Review
. 2016 Nov;12(11):667-677.
doi: 10.1038/nrneph.2016.135. Epub 2016 Oct 3.

The importance of total kidney volume in evaluating progression of polycystic kidney disease

Affiliations
Review

The importance of total kidney volume in evaluating progression of polycystic kidney disease

Jared J Grantham et al. Nat Rev Nephrol. 2016 Nov.

Abstract

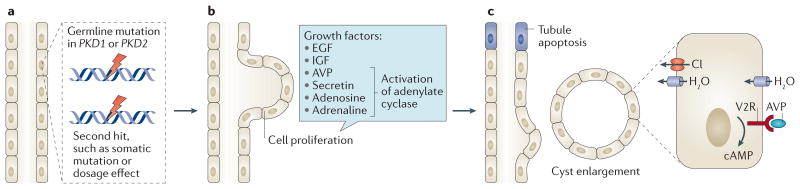
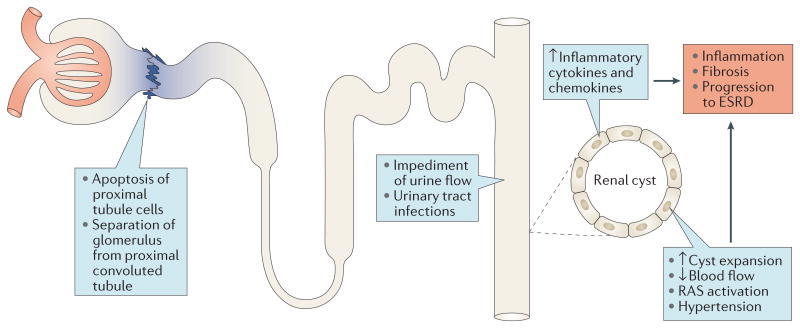
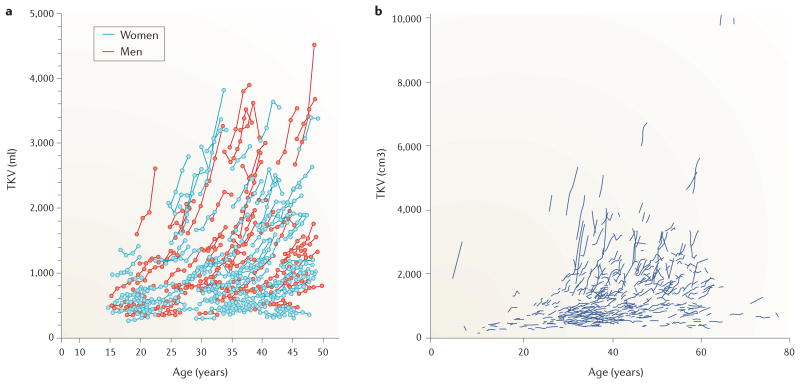
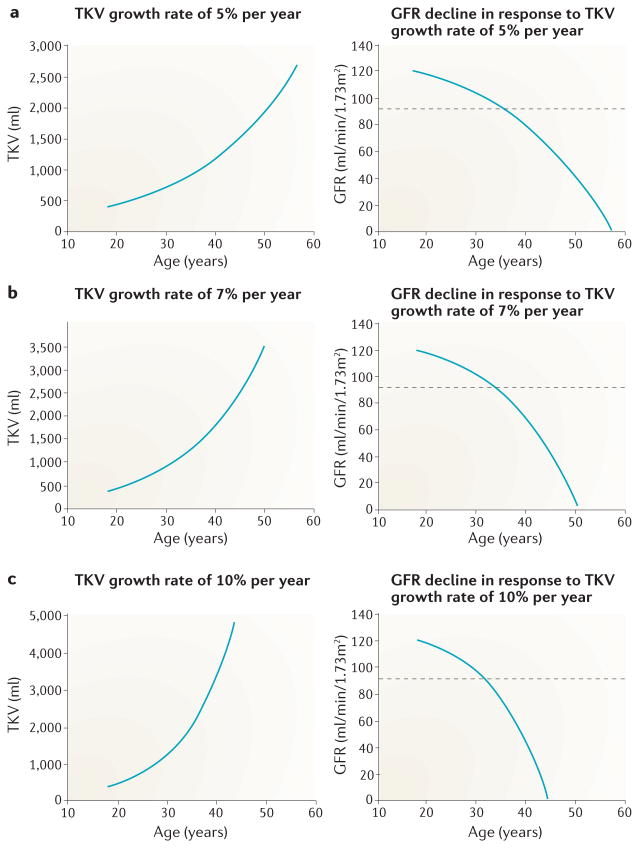
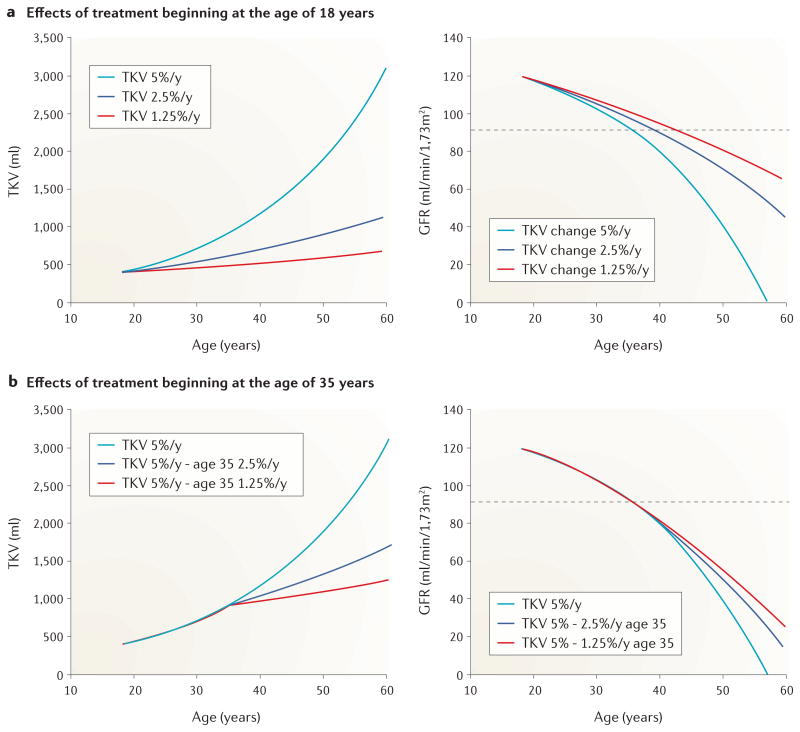
The rate at which autosomal dominant polycystic kidney disease (ADPKD) progresses to end-stage renal disease varies widely and is determined by genetic and non-genetic factors. The ability to determine the prognosis of children and young adults with ADPKD is important for the effective life-long management of the disease and to enable the efficacy of emerging therapies to be determined. Total kidney volume (TKV) reflects the sum volume of hundreds of individual cysts with potentially devastating effects on renal function. The sequential measurement of TKV has been advanced as a dynamic biomarker of disease progression, yet doubt remains among nephrologists and regulatory agencies as to its usefulness. Here, we review the mechanisms that lead to an increase in TKV in ADPKD, and examine the evidence supporting the conclusion that TKV provides a metric of disease progression that can be used to assess the efficacy of potential therapeutic regimens in children and adults with ADPKD. Moreover, we propose that TKV can be used to monitor treatment efficacy in patients with normal levels of renal function, before the pathologic processes of ADPKD cause extensive fibrosis and irreversible loss of functioning renal tissue.


Figures

Figure 1
Figure 1. The formation and expansion of a tubule cyst
a | Germline mutations in PKD1 or PKD2 do not direcly cause tubule cells to hyperproliferate. Rather, hyperproliferation and cyst formation might require a germline mutation in PKD1 or PKD2 to occur concomitantly with a somatic mutation or chemical injury. Such a ‘second hit’ would not necessarily affect a polycystin on the normal allele and could instead disrupt other related genes. A dosage threshold for polycystin might determine the timing and extent of cyst formation. b | Proliferation of tubule cells in response to growth factors results in expansion of the tubule wall, which starts to bulge into the interstitium. c | A point is reached at which the nascent cyst breaks free of the parent tubule, becoming an autonomous cyst. The separation of the cyst from the tubule might occur as a result of tubule apoptosis, which occurs via an unknown mechanism. The cyst expands and fills with fluid that is secreted into it by mechanisms involving cyclic (c)AMP-mediated chloride (Cl) influx and arginine vasopressin (AVP)-driven fluid intake. Individual cysts begin as structures with diameters of ∼0.10 mm and expand to >50 mm in advanced cases. EGF, epidermal growth factor; IGF, insulin-like growth factor; H20, water; V2R, arginine vasopressin receptor 2.
Figure 2
Figure 2. Features of early cyst formation
a | Haematoxylin and eosin stain of a nascent renal cyst from a Han rat: a model of autosomal dominant polycystic kidney disease (ADPKD) caused by a missense mutation in ANKS6. The cells in the lower half of the image appear normal with brush borders typical of proximal tubules, whereas in the cystic upper half of the image the cells are flattened, with no brush borders and cramped nuclei. The extracellular matrix beneath the cystic cells is expanded and the tubule basement membrane (TBM) is thickened. Mononuclear inflammatory cells have invaded the interstitium adjacent to the cystic portion of the tubule. On microscopic analysis, a similar association between epithelial cell dedifferentiation and an abnormal underlying basement membrane has been observed in PKD1 and PKD2 murine models of ADPKD (J.J. Grantham & V.E. Torres, unpublished work). b | The first column (Pkhd1-/- AVP+/+) shows cross sections of kidneys from female (F) and male (M), 12-week-old rats, demonstrating an abundance of medullary cysts in the absence of Pkhd1 when arginine vasopressin (AVP) signalling is intact. In Pkhd1-/- AVP-/- rats (second column), which lack Pkhd1 and AVP signalling, very few cysts can be discerned. c | In Pkhd1-/- AVP-/- rats, administration of the AVP V2-receptor agonist, desmopressin, from 12–20 weeks of age results in the formation of visible cysts. Images reproduced with permission from Elsevier Ltd © Shizuko Nagao et al. Kidney Int. 63, 427–437 (2003).
Figure 3
Figure 3. Potential influence of collecting duct cyst formation on upstream tubule segments and renal function
The formation of a renal cyst reduces or stops flow in the collecting duct of origin and, through compression, in adjacent normal tubules, capillaries, venules and arterioles. These effects lead to activation of the renin–angiotensin–system (RAS), which results in hypertension. The reduced flow of urine in the upstream nephrons that drain into a collecting duct cyst leads to apoptosis of proximal tubule cells at the junction with the glomerulus, resulting in the formation of atubular glomeruli and disconnected downstream nephron segments that undergo extensive apoptosis. The degenerating tubules and expanding cysts release inflammatory cytokines and chemokines that contribute to fibrosis and progression to end-stage renal disease (ESRD).
Figure 4
Figure 4. Relationship between age and total kidney volume (TKV) in patients with autosomal dominant polycystic kidney disease
The relationships between age and TKV are illustrated for individual patients from two large longitudinal studies in a | the USA and b | in China. An exponential-like pattern in TKV increase was observed in both studies. Considerable heterogeneity exists in the rates of TKV increase, ranging from <0.5% per year to >20% per year. The mean rate of TKV growth was 5.3% per year in participants from the US study and 5.7% per year in participants from the Chinese study. Part a | reproduced with permission from Massachusetts Medical Society © Jared J. Grantham et al. N. Engl. J. Med. 354, 2122–2130 (2006). Part b | reproduced with permission from PLOS © Dongping Chen. et al. PLoS ONE 9, e92232 (2014), which is licensed under a Creative Commons Attribution 4.0 International Licence. To view a copy of this licence, visit https://creativecommons.org/licenses/by/4.0/.
Figure 5
Figure 5. Hypothetical inverse relationship between total kidney volume (TKV) and glomerular filtration rate (GFR) in patients with autsomal dominant polycystic kidney disease (ADPKD)
Increasing rates of TKV growth are shown by exponential-like curves. The corresponding GFR curves are based on the assumption that, in the absence of modifying factors, GFR decline is linked to the progressive increase in TKV in patients with ADPKD. At the age of 18 years, TKV is assumed to be 400 ml and GFR 120 ml/min/1.73 m. GFR in each succeeding year is determined from the equation GFR = (GFRt-1) – (TKVt/400) where t is age and t-1 is age minus 1 year. GFR decline is determined by the fractional increase in TKV (TKVt/400). The model illustrates the initial decades during which GFR remains within normal limits shown by values above the dashed horizontal line depicting the lower limit of chronic kidney disease stage 1; the escalating rate of GFR decline over time; and the inverse relationship between GFR decline and the formation and expansion of cysts as measured by TKV. a | For a TKV increase of 5% per year, GFR reaches 0.0 ml/min/1.73 m at 57 years of age. b | For a TKV increase of 7% per year GFR reaches 0.0 ml/min/1.73 m at 50 years of age. c | For a TKV increase of 10% per year GFR reaches 0.0 ml/min/1.73 m at 43 years of age.
Figure 6
Figure 6. Hypothetical effect of starting therapy for autosomal dominant polycystic kidney disease (ADPKD) at 18 years or 35 years of age
These graphs, which are based on the assumption that decline in glomerular filtration rate (GFR) in ADPKD is linked to the progressive increase in total kidney volume (TKV), show the potential effect of treatment on the annual rate of TKV growth. GFR values above the dashed horizontal line fall within chronic kidney disease stage 1. The baseline rate of 5% increase in TKV per year can be reduced to 2.5% or 1.25% per year regardless of whether treatment is started at 18 years or 35 years of age. a | If treatment is started at 18 years of age, a patient with a TKV growth rate of 5% per year will experience a decline in GFR to 0.0 ml/min/1.73 m at 57 years of age; a patient with a TKV growth rate of 2.5% per year will reach a GFR of 0.0 ml/min/1.73 m at around 70 years of age; a patient with a TKV growth rate of 1.25% per year will reach a GFR of 0.0 ml/min/1.73 m at >70 years of age. b | If treatment is initiated at 35 years of age, reductions in TKV from baseline and in the rate of GFR decline are more modest than if treatment is started at 18 years of age. A TKV growth rate reduction to 2.5% per year at the age of 35 years will lead to a GFR decline to 0.0 ml/min/1.73 m at 65 years of age, whereas a TKV growth rate reduction to 1.25% per year will lead to a GFR decline to 0.0 ml/min/1.73 m at 70 years of age. The model illustrates that reductions in the rate of TKV growth might be associated with substantial preservation of renal function if treatment is initiated relatively early in life, and that beginning treatment by 35 years of age could provide a modest, but worthwhile preservation of renal function.

References

    1. Grantham JJ. Clinical practice. Autosomal dominant polycystic kidney disease. N Engl J Med. 2008;359:1477–1485. - PubMed
    1. Franz KA, Reubi FC. Rate of functional deterioration in polycystic kidney disease. Kidney Int. 1983;23:526–529. - PubMed
    1. Dalgaard OZ. Bilateral polycystic disease of the kidneys; a follow-up of 284 patients and their families. Dan Med Bull. 1957;4:128–133. - PubMed
    1. Levine E, Grantham JJ. The role of computed tomography in the evaluation of adult polycystic kidney disease. Am J Kidney Dis. 1981;1:99–105. - PubMed
    1. Gabow PA, Ikle DW, Holmes JH. Polycystic kidney disease: prospective analysis of nonazotemic patients and family members. Ann Intern Med. 1984;101:238–247. - PubMed