. 2016 Oct 3:7:12995.
doi: 10.1038/ncomms12995.

The optical frequency comb fibre spectrometer

Affiliations

The optical frequency comb fibre spectrometer

Nicola Coluccelli et al. Nat Commun. .

Abstract

Optical frequency comb sources provide thousands of precise and accurate optical lines in a single device enabling the broadband and high-speed detection required in many applications. A main challenge is to parallelize the detection over the widest possible band while bringing the resolution to the single comb-line level. Here we propose a solution based on the combination of a frequency comb source and a fibre spectrometer, exploiting all-fibre technology. Our system allows for simultaneous measurement of 500 isolated comb lines over a span of 0.12 THz in a single acquisition; arbitrarily larger span are demonstrated (3,500 comb lines over 0.85 THz) by doing sequential acquisitions. The potential for precision measurements is proved by spectroscopy of acetylene at 1.53 μm. Being based on all-fibre technology, our system is inherently low-cost, lightweight and may lead to the development of a new class of broadband high-resolution spectrometers.


Figures

Figure 1
Figure 1. Layout of the experimental set-up for parallel comb spectroscopy.
The repetition frequency fr and offset frequency fo of the Er:fibre OFC are locked to an Rb standard disciplined by a GPS. The OFC output beam passes through the gas cell filled with 12C2H2 at 10 mbar and is multiplexed with the SF laser output beam inside the PM fibre; both beams are coupled into the MM fibre held in the temperature-stabilized aluminium chamber. The speckle pattern emerging from the MM fibre is finally imaged onto the InGaAs camera and processed by a laptop pc. DDS, Direct Digital Synthesizer; ECDL, extended cavity diode laser; PD, photodiode; PZT, piezoelectric transducer; SC, supercontinuum.
Figure 2
Figure 2. Resolution of the fibre spectrometer and correlation between speckle patterns.
(a) Spectrum of a narrow-linewidth SF laser at 1,535.3 nm showing the 0.96-pm (120 MHz) resolution of the MM fibre spectrometer. (b) Calculated correlation coefficient between the first speckle pattern stored in the calibration matrix, corresponding to 1,535 nm, and all the following patterns acquired during the calibration process by tuning the SF laser at steps of 2 pm (250 MHz) up to 1,536 nm; (c) corresponding detuning between the optical frequency νcw of the SF laser and the nearest comb tooth at νn, as measured by a frequency counter with gate time of 50 ms.
Figure 3
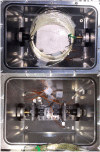
Figure 3. Top-view of the MM fibre and aluminium chamber.
The 100-m long MM fibre is coiled and housed in an aluminium chamber (150 × 150 × 220 mm3) to provide thermal stability and isolation against external air flowing. Temperature sensors monitor the temperature inside the chamber.
Figure 4
Figure 4. Long-term stability of the OFC fibre spectrometer.
(a,c) Speckle patterns of the narrow-linewidth SF laser and OFC at 1,535.3 nm emerging from the output of the MM fibre and imaged onto the InGaAs camera. Typical values for the speckle contrast (see ‘Methods' section for definitions) of the SF laser and OFC are 0.710 and 0.078, respectively. (b,d) Autocorrelation coefficient of the speckle patterns and temperature of the MM fibre as a function of time. To avoid frequency drift, the speckle patterns of the SF laser and OFC have been acquired with the laser locked to the OFC which is in turn locked to a Rb standard disciplined by a GPS. A speckle pattern has been stored every Δt=10 s and correlated to the pattern acquired at t=0 s; a degradation of nearly 1% and 0.01% after 3 h is observed in the autocorrelation trace of the SF laser and OFC, respectively.
Figure 5
Figure 5. DCS of acetylene and detection limit set by amplitude noise.
(a) Comb spectrum transmitted by the acetylene gas cell as retrieved by the reconstruction algorithm (no averages) over a span of 1 nm (500 comb teeth) with frequency sampling of 250 MHz. Each circle represents the amplitude of a single comb line. The inset shows the corresponding speckle pattern (contrast of 0.078). (b) Absorption coefficient of the P(17) and P(7) lines of the ν1+ν3 band of 12C2H2 at 10 mbar. The transmission spectra of the cell have been measured with a single camera exposure (blue circles, offset by 0.1 cm−1 for clarity) or by the average of 10 frames (red circles). (c) Residuals of the Voigt profile fits to the absorption lines obtained by the single (blue circles, offset by 0.02 cm−1) and averaged camera frames (red circles). The main absorption peak observed in the measurement with SNR of 85 (red line) has a line centre wavelength of 1,535.392630±0.000027, nm retrieved from the fit. A secondary absorption peak of amplitude 6.4 × 10⁻³ cm−1 is clearly distinguished over the noise. (d) s.d. of the absorption noise σn as a function of the number of averaged speckle patterns, as measured with the fibre spectrometer operating in standard conditions (blue squares) or by illuminating the camera with a tungsten lamp (green triangles). Also shown the limits set by the camera white noise (red dotted line) and comb flicker noise (black dotted line). The error bars represent the s.d. of σn over separate sets of images.
Figure 6
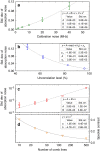
Figure 6. Noise analysis for different noise sources.
(a) Std. dev. of absorption noise as a function of Std. dev. of calibration noise. The absorption noise has been evaluated by using a high-spectral purity Er:fibre laser locked to the OFC during calibration (see ‘Methods' section for details). (b) Std. dev. of absorption noise as a function of the uncorrelation level between the speckle patterns acquired during the calibration of the spectrometer. The uncorrelation has been intentionally degraded by modifying the coupling from the single mode PM fibre to the MM fibre. After calibration, the comb speckle patterns have been acquired and then the absorption noise has been calculated. (c) Std. dev. of absorption noise as a function of the number of comb lines in a speckle pattern. The OFC has been filtered by the Fabry–Perot cavity to select a subset of comb lines with desired number of lines. (d) Speckle contrast as a function of the number of comb lines. All data have been acquired with speckle pattern averaging set to 10.
Figure 7
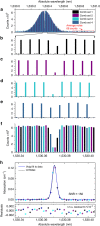
Figure 7. Interleaved DCS demonstrating identification and resolution of each comb line.
(a) Interleaved comb spectra as retrieved by the reconstruction algorithm over a span of 1 nm (500 comb teeth). (be) Expanded view of the subset of comb lines. The Fabry–Perot cavity transmits one comb tooth over four (attenuation of 25–30 dB out of resonance), resulting in an under-sampled comb with frequency spacing of 1 GHz. The amplitudes and frequencies of the components constituting each sub-comb are accurately retrieved by the reconstruction algorithm. (f) Expanded view of the interleaved combs. (g) Absorption coefficient as calculated from the ratio between the transmission of the cell filled with 12C2H2 at 10 mbar and in empty condition (blue circles). The absorption data have been fitted by a Voigt profile (blue line) and compared with the absorption data extracted from the HITRAN database. The line centre wavelength with standard error resulting from the fitting is 1,530.371020±0.000021, nm.
Figure 8
Figure 8. Sequential acquisition of adjacent spectra showing wide spectral coverage.
(a) A sequence of transmission spectra by a 142-mm cell filled with pure 12C2H2 at pressure of 10 mbar acquired with the MM fibre spectrometer. The sequence has been measured by setting a tunable filter (−10 dB band of 0.6 nm) at the desired central wavelength and imaging the speckle patterns at the MM fibre output onto an InGaAs camera (40-μs exposure time, 10 frames averaged). Each spectrum spans 1 nm and is sampled by ∼500 comb lines. (b) Transmission spectrum of the 12C2H2 cell, as calculated by fitting the experimental data corresponding to the main absorptions (red line, bottom) and retrieved from the HITRAN database (blue line, top). The standard error on the centre wavelength of the fitted absorption lines is better than 0.028 pm (±3.5 MHz at 1.53 μm).

References

    1. Diddams S. A. et al.. Direct link between microwave and optical frequencies with a 300 THz femtosecond laser comb. Phys. Rev. Lett. 84, 5102–5105 (2000). - PubMed
    1. Jones D. J. et al.. Carrier-envelope phase control of femtosecond modelocked lasers and direct optical frequency synthesis. Science 288, 635–639 (2000). - PubMed
    1. Baltuska A. et al.. Attosecond control of electronic processes by intense light fields. Nature 421, 611–615 (2003). - PubMed
    1. Cundiff S. T. & Weiner A. M. Optical arbitrary waveform generation. Nat. Photonics 4, 760–766 (2010).
    1. Rieker G. B. et al.. Frequency-comb-based remote sensing of greenhouse gases over kilometer air paths. Optica 1, 290–298 (2014).

Publication types

LinkOut - more resources