. 2016 Dec;17(12):1459-1466.
doi: 10.1038/ni.3577. Epub 2016 Oct 3.

Foxp3 and Toll-like receptor signaling balance Treg cell anabolic metabolism for suppression

Affiliations

Foxp3 and Toll-like receptor signaling balance Treg cell anabolic metabolism for suppression

Valerie A Gerriets et al. Nat Immunol. 2016 Dec.

Abstract

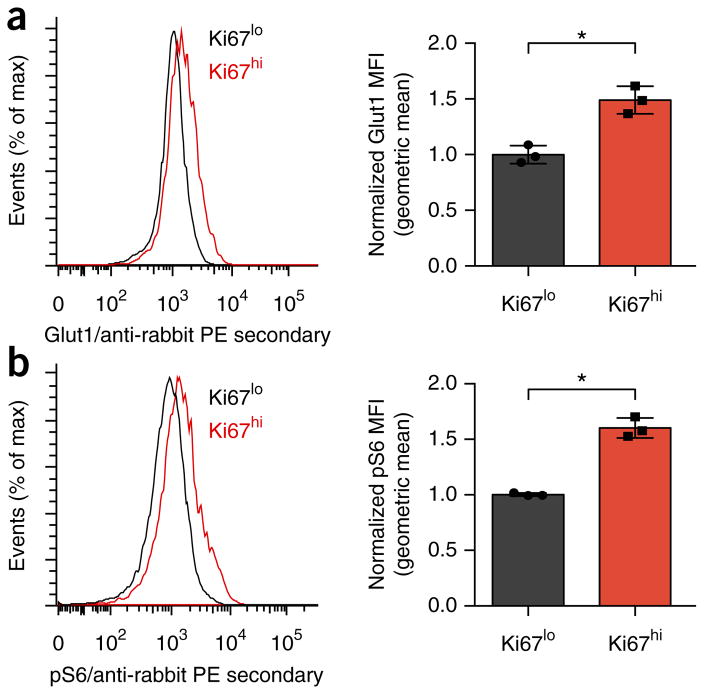
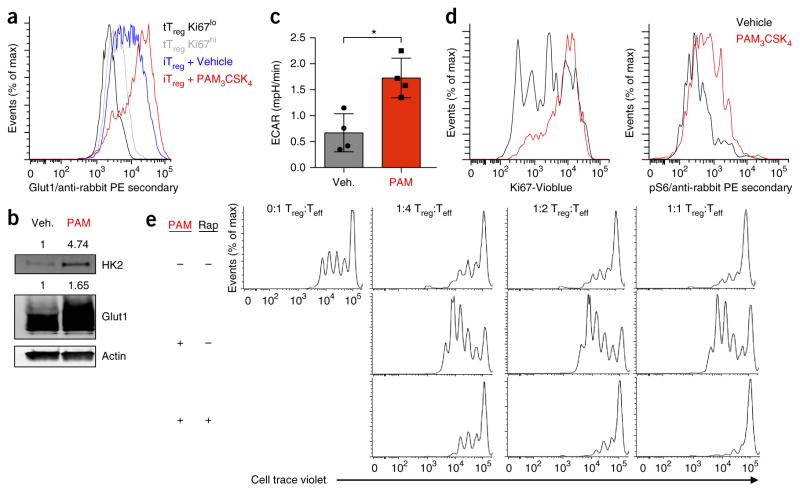
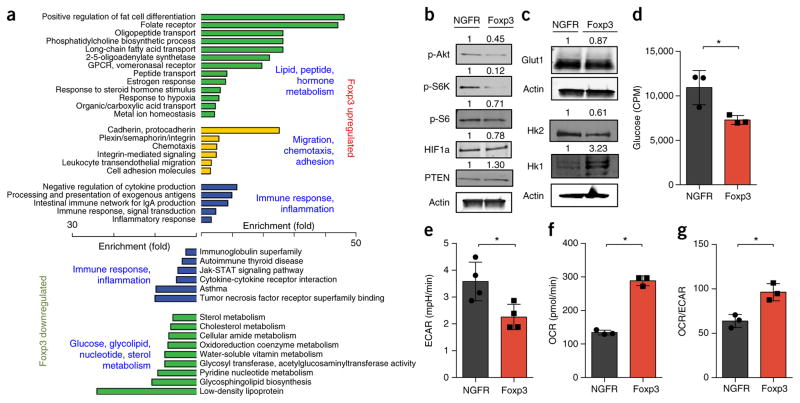
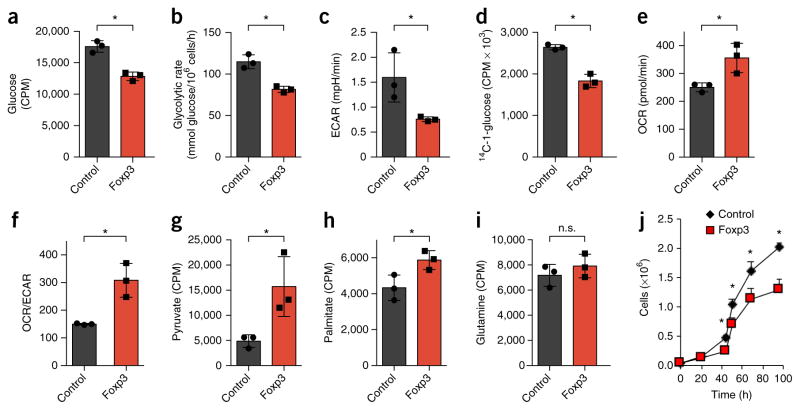
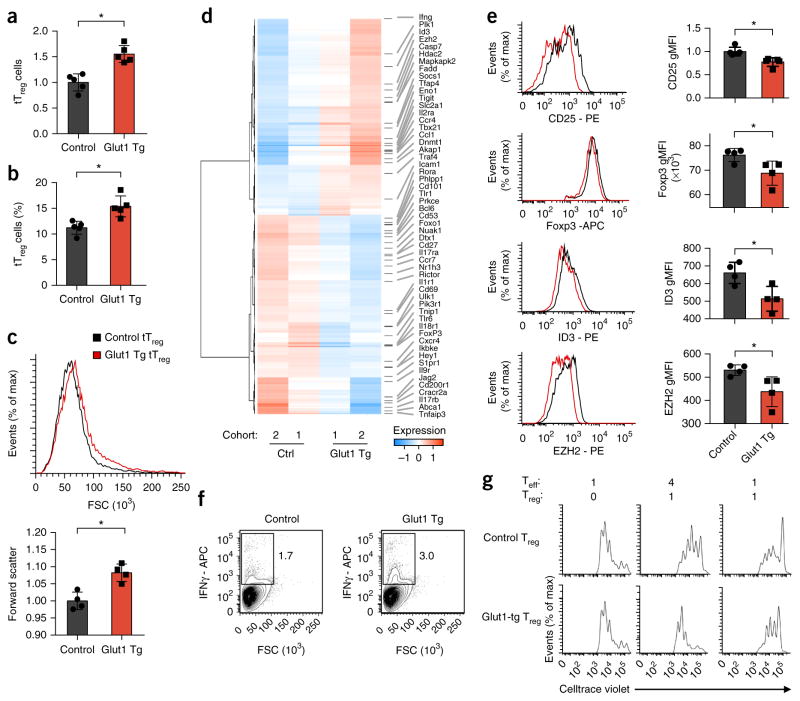
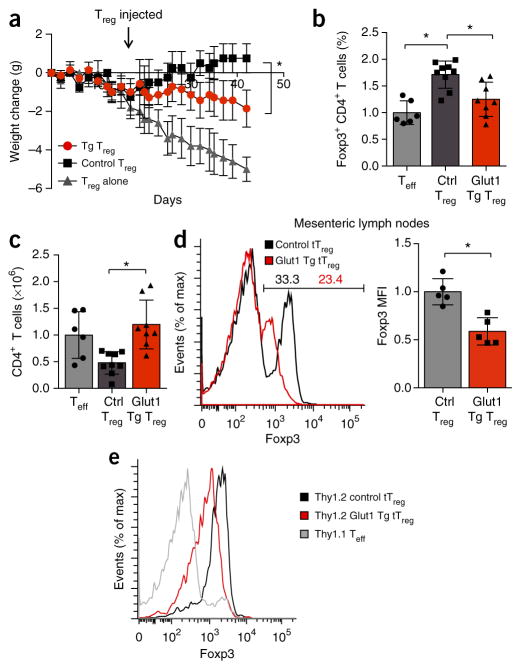
CD4+ effector T cells (Teff cells) and regulatory T cells (Treg cells) undergo metabolic reprogramming to support proliferation and immunological function. Although signaling via the lipid kinase PI(3)K (phosphatidylinositol-3-OH kinase), the serine-threonine kinase Akt and the metabolic checkpoint kinase complex mTORC1 induces both expression of the glucose transporter Glut1 and aerobic glycolysis for Teff cell proliferation and inflammatory function, the mechanisms that regulate Treg cell metabolism and function remain unclear. We found that Toll-like receptor (TLR) signals that promote Treg cell proliferation increased PI(3)K-Akt-mTORC1 signaling, glycolysis and expression of Glut1. However, TLR-induced mTORC1 signaling also impaired Treg cell suppressive capacity. Conversely, the transcription factor Foxp3 opposed PI(3)K-Akt-mTORC1 signaling to diminish glycolysis and anabolic metabolism while increasing oxidative and catabolic metabolism. Notably, Glut1 expression was sufficient to increase the number of Treg cells, but it reduced their suppressive capacity and Foxp3 expression. Thus, inflammatory signals and Foxp3 balance mTORC1 signaling and glucose metabolism to control the proliferation and suppressive function of Treg cells.


Conflict of interest statement

The authors declare no competing financial interests.

Figures

Figure 1
Figure 1
Treg cell proliferation is associated with increased glycolysis and anabolic signaling. (a,b) Flow cytometry analyzing the expression of Glut1 (a) and phosphorylated S6 (p-S6) (b) in Ki67high and Ki67low populations of CD4+Foxp3+ tTreg cells from the spleens of wild-type mice (gating strategy, Supplementary Fig. 1a). MFI, mean fluorescent intensity. *P < 0.05 (two-tailed Student’s t test). Data in a and b are each representative of three independent experiments (left) or are pooled and normalized to Ki67low from three independent experiments (right; mean + s.d.).
Figure 2
Figure 2
Signaling via TLR1 and TLR2 drives Treg cell glycolysis and proliferation, yet reduces suppressive capacity. (a) Glut1 expression (as in Fig. 1) of Ki67high and Ki67low tTreg cells derived from the spleens of wild-type mice an of iTreg cells derived from CD4+CD25 T cells isolated from the spleens of wild-type mice and polarized for 5 d under Treg cell–skewing conditions and treated with H2O vehicle (Veh) or Pam3CSK4 (PAM; 5 μg/ml) for the final 24 h. (b) Immunoblot analysis of HK2, Glut1 and actin (loading control) in iTreg cells as in a. (c,d) ECAR of vehicle or Pam3CSK4 treated iTreg (c), and Ki67 expression and phosphorylated S6, determined by flow cytometry (d), in iTreg cells as in a. (e) Inhibition of the proliferation of Teff cells by Treg cells treated for 24 h with DMSO (vehicle (−)) or 20 nM rapamycin (Rap) along with Pam3CSK4 (5 μg/ml) (left margin), then repurified by magnetic selection and functionally assessed an in vitro suppression assay with various ratios (above plots) of Treg cells to Teff cells. *P < 0.05 (Two-tailed Student’s t-test). Data are representative of three independent experiments (a,b,d,e) or two independent experiments with four technical replicates per group (c; mean + s.d.).
Figure 3
Figure 3
Foxp3 reduces aerobic glycolysis and promotes mitochondrial oxidative metabolism. (a) Gene-expression microarray analysis and pathway analysis (with the DAVID bioinformatics database) of RNA from primary mouse CD4+CD25 T cells stimulated and transduced with control or Foxp3-expressing retrovirus, presented as enrichment for selected pathways (left and right margins) among genes upregulated (top) or downregulated (bottom) by Foxp3. (bg) Immunoblot analysis (b,c), glucose uptake (d), glycolysis (as ECAR after glucose injection) (e) basal OCR (f) and basal OCR/ECAR (g) of primary mouse CD4+CD25 T cells stimulated and transduced with control (NGFR) or Foxp3-expressing retrovirus. Numbers above lanes (b,c) indicate band intensity relative to that of actin. CPM, counts per minute. *P < 0.05 (Two-tailed Student’s t-test). Data are representative of an experiment with biological triplicates for each group (a), three independent experiments (b,c) or two independent experiments with technical triplicates (dg; mean + s.d.).
Figure 4
Figure 4
Foxp3 expression is sufficient to suppress glycolysis and promote oxidative metabolism. (ai) Glucose uptake (a), glycolytic rate (assessed by a radiolabeled-glucose-tracer assay) (b), ECAR (c), flux of glucose into the pentose phosphate pathway (PPP) (d), OCR (e), OCR/ECAR (f), pyruvate oxidation (g), fatty-acid oxidation of palmitate (h) and glutamine oxidation (i) of vector-control-transduced FL5.12 pro-B cells or FL5.12 pro-B cells transduced with tamoxifen-inducible expression of Foxp3, treated with 4-hydroxytamoxifen. (j) Quantification of live cells as in ai to assess cell accumulation over time. *P < 0.05 (two-tailed Student’s t test). Data are representative of three (a,b,j) or two (ci) independent experiments with three independent clones per group (mean + s.d. in ai or (mean ± s.d. in j).
Figure 5
Figure 5
Glut1 expression increases the number and size of Treg cells but reduces their suppressive capacity. (ac) Number (a), frequency (b) and size (by forward scatter (FSC)) (c) of Foxp3+ tTreg cells from the spleen of control and Glut1-tg mice, assessed by flow cytometry. (d) RNA-sequencing analysis of Treg cells from age-matched control and Glut1-tg mice (two independent cohorts), presented as normalized data. (e,f) Flow cytometry analyzing the expression of CD25, Foxp3, ID3 and EZH2 (e) or IFN-γ (f) by CD4+CD25 T cells isolated from the spleen of control and Glut1-tg mice and polarized under Treg cell–skewing conditions; results presented as the geometric mean fluorescent intensity (MFI) in e, right. Numbers adjacent to outlined areas (f) indicate percent IFN-γ+ cells. (g) Inhibition of Teff cell proliferation by control and Glut1-tg Treg cells as in e,f (presented as in Fig. 2e). *P < 0.05 (two-tailed Student’s t test). Data are representative of five independent experiments (a,b; mean + s.d.), four independent experiments (c; mean + s.d.), an experiment with two independent cohorts (two control mice with three Glut1-tg mice, and three control mice with one Glut1-tg mouse) (d), an experiment with four biological replicates per genotype (e,f; mean + s.d. in e) or three independent experiments (g).
Figure 6
Figure 6
Increased glucose uptake impairs the suppressive ability of Treg cells. (a) Body weight of T cell– and B cell–deficient Rag1−/− host mice given injection of sorted naive Teff cells (CD4+CD25CD45RBhi) for the induction of colitis, then (after weight loss indicated active disease), given injection of no additional cells (Teff alone) or control or Glut1-Tg CD4+CD25+CD45RBlo Treg cells (downward arrow), assessed by weighing three times per week and presented as change from initial weight. (be) Frequency of CD4+Foxp3+ T cells (b), number of CD4+ T cells (c) in each Treg cell recipient group, and expression of Foxp3 and the MFI of Foxp3 expression of CD4+Foxp3+ T cells in the mesenteric lymph nodes (d,e) of mice as in a (with naive effector cells expressing Thy1.1 and Treg cells expressing Thy1.2 in e, to allow distinction of cells by these congenic markers). *P < 0.05 (bd; two-tailed Student’s t test, a; two-way ANOVA followed by Tukey’s post hoc test). Data are representative of at least three independent experiments with over four mice per group in each (a; mean ± s.e.m.), two independent experiments with n = 6 mice (Teff cells alone), n = 9 mice (control Treg cells) or n = 8 mice (Glut1-Tg Treg cells) (b,c; mean + s.d.), two experiments with at least four mice per group (c; mean + s.d.), or one experiment with n = 4 mice (Teff cells alone), n = 4 mice (control Treg cells) or n = 5 mice (Glut1-Tg Treg cells) (e).

Comment in

References

    1. Buck MD, O’Sullivan D, Pearce EL. T cell metabolism drives immunity. J Exp Med. 2015;212:1345–1360. - PMC - PubMed
    1. DeBerardinis RJ, Chandel NS. Fundamentals of cancer metabolism. Sci Adv. 2016;2:e1600200. - PMC - PubMed
    1. Chang CH, et al. Post-transcriptional control of T cell effector function by aerobic glycolysis. Cell. 2013;153:1239–1251. - PMC - PubMed
    1. Macintyre AN, et al. The glucose transporter Glut1 is selectively essential for CD4 T cell activation and effector function. Cell Metab. 2014;20:61–72. - PMC - PubMed
    1. Beier UH, et al. Essential role of mitochondrial energy metabolism in Foxp3+ T-regulatory cell function and allograft survival. FASEB J. 2015;29:2315–2326. - PMC - PubMed

MeSH terms

Substances