

Time-resolved metabolomics analysis of individual differences during the early stage of lipopolysaccharide-treated rats
- PMID: 27695004
- PMCID: PMC5046119
- DOI: 10.1038/srep34136
Time-resolved metabolomics analysis of individual differences during the early stage of lipopolysaccharide-treated rats
Abstract
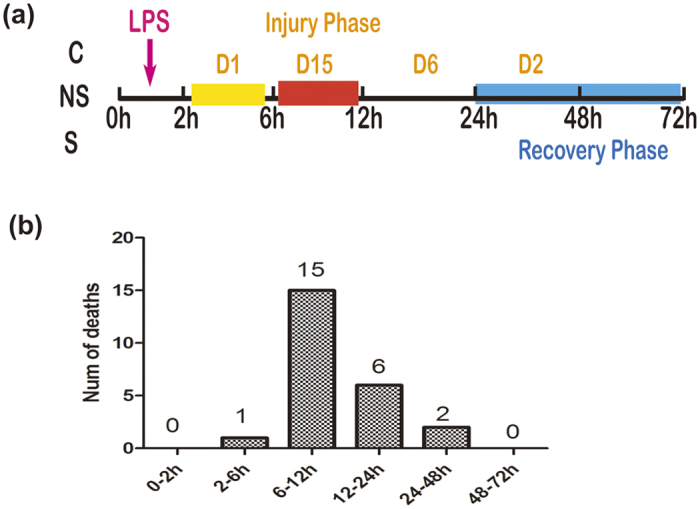
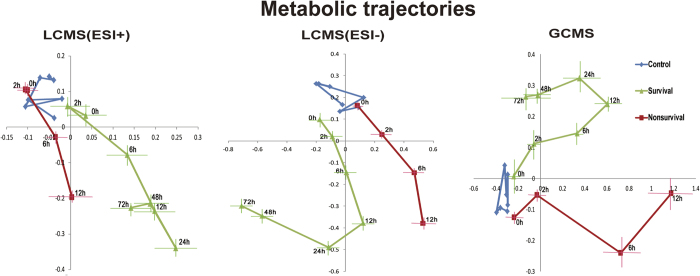
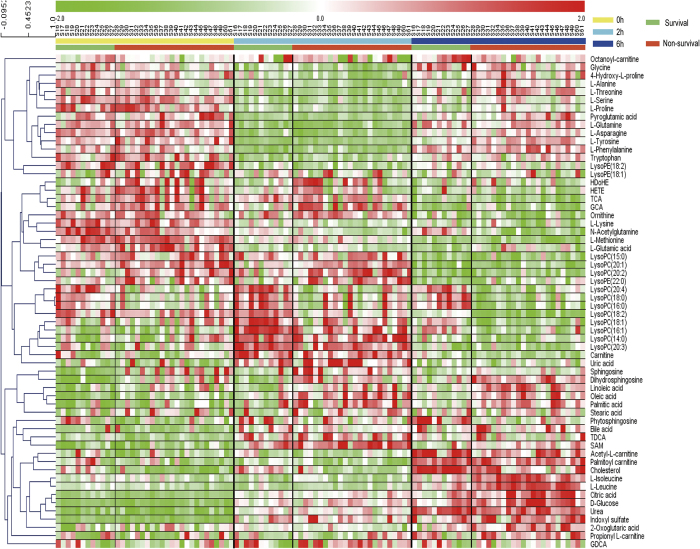
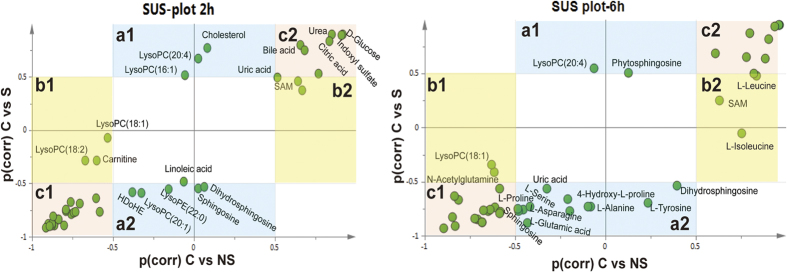
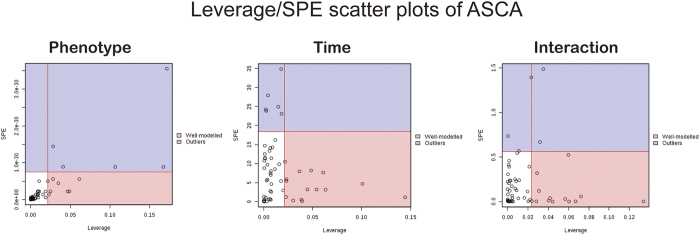
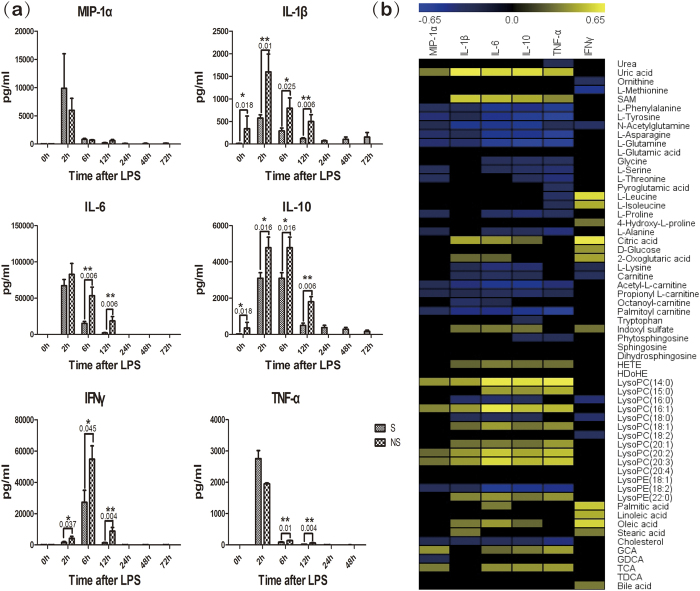
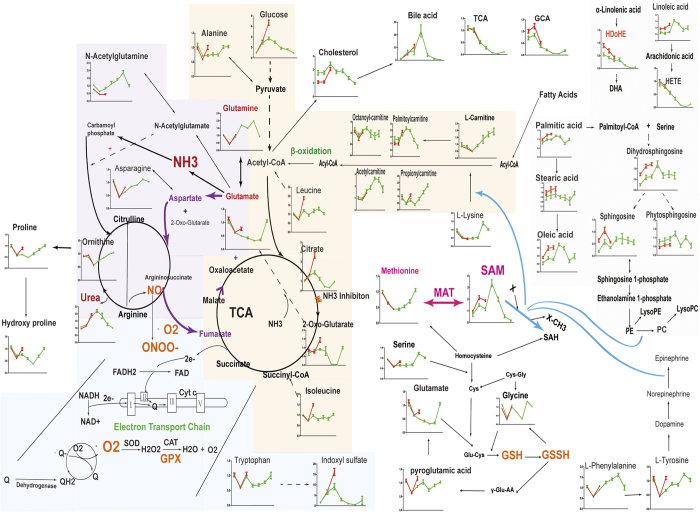
Lipopolysaccharide (LPS) can lead to uncontrollable cytokine production and eventually cause fatal sepsis syndrome. Individual toxicity difference of LPS has been widely reported. In our study we observed that two thirds of the rats (24/36) died at a given dose of LPS, while the rest (12/36) survived. Tracking the dynamic metabolic change in survival and non-survival rats in the early stage may reveal new system information to understand the inter-individual variation in response to LPS. As the time-resolved datasets are very complex and no single method can elucidate the problem clearly and comprehensively, the static and dynamic metabolomics methods were employed in combination as cross-validation. Intriguingly, some common results have been observed. Lipids were the main different metabolites between survival and non-survival rats in pre-dose serum and in the early stage of infection with LPS. The LPS treatment led to S-adenosly-methionine and total cysteine individual difference in early stage, and subsequent significant perturbations in energy metabolism and oxidative stress. Furthermore, cytokine profiles were analyzed to identify potential biological associations between cytokines and specific metabolites. Our collective findings may provide some heuristic guidance for elucidating the underlying mechanism of individual difference in LPS-mediated disease.
Figures
Similar articles
-
Gas chromatography-mass spectrometry metabolomic study of lipopolysaccharides toxicity on rat basophilic leukemia cells.Chem Biol Interact. 2018 Feb 1;281:81-88. doi: 10.1016/j.cbi.2017.12.008. Epub 2017 Dec 22. Chem Biol Interact. 2018. PMID: 29275087
-
Metabolomic analysis reveals metabolic disturbances in the prefrontal cortex of the lipopolysaccharide-induced mouse model of depression.Behav Brain Res. 2016 Jul 15;308:115-27. doi: 10.1016/j.bbr.2016.04.032. Epub 2016 Apr 19. Behav Brain Res. 2016. PMID: 27102340
-
Metabolomic analysis reveals metabolic changes caused by bisphenol A in rats.Toxicol Sci. 2014 Apr;138(2):256-67. doi: 10.1093/toxsci/kfu016. Epub 2014 Jan 21. Toxicol Sci. 2014. PMID: 24449424
-
Human metabolic response to systemic inflammation: assessment of the concordance between experimental endotoxemia and clinical cases of sepsis/SIRS.Crit Care. 2015 Mar 3;19(1):71. doi: 10.1186/s13054-015-0783-2. Crit Care. 2015. PMID: 25887472 Free PMC article.
-
Construction and analysis of correlation networks based on gas chromatography-mass spectrometry metabonomics data for lipopolysaccharide-induced inflammation and intervention with volatile oil from Angelica sinensis in rats.Mol Biosyst. 2015 Nov;11(11):3174-87. doi: 10.1039/c5mb00405e. Mol Biosyst. 2015. PMID: 26399193
Cited by
-
Quantitative Evaluation of the Compatibility Effects of Huangqin Decoction on the Treatment of Irinotecan-Induced Gastrointestinal Toxicity Using Untargeted Metabolomics.Front Pharmacol. 2017 Apr 21;8:211. doi: 10.3389/fphar.2017.00211. eCollection 2017. Front Pharmacol. 2017. PMID: 28484391 Free PMC article.
-
Metabolic profiling in experimental guinea pig models of bacterial and allergic inflammation.Metabolomics. 2025 Mar 23;21(2):43. doi: 10.1007/s11306-025-02239-x. Metabolomics. 2025. PMID: 40123009 Free PMC article.
-
Evaluation of the Efficacy of a Lactobacilli-Based Teat Detergents for the Microbiota of Cows Teats Using an Untargeted Metabolomics Approach.J Microbiol Biotechnol. 2024 Jan 28;34(1):103-115. doi: 10.4014/jmb.2305.05016. Epub 2023 Sep 22. J Microbiol Biotechnol. 2024. PMID: 37957117 Free PMC article.
-
Post-inflammatory behavioural despair in male mice is associated with reduced cortical glutamate-glutamine ratios, and circulating lipid and energy metabolites.Sci Rep. 2020 Oct 8;10(1):16857. doi: 10.1038/s41598-020-74008-w. Sci Rep. 2020. PMID: 33033375 Free PMC article.
-
Comparison of Chemical Profiles, Anti-Inflammatory Activity, and UPLC-Q-TOF/MS-Based Metabolomics in Endotoxic Fever Rats between Synthetic Borneol and Natural Borneol.Molecules. 2017 Aug 31;22(9):1446. doi: 10.3390/molecules22091446. Molecules. 2017. PMID: 28858264 Free PMC article.
References
-
- Zipfel C. A new receptor for LPS. Nat. Immunol. 16, 340–341 (2015). - PubMed
-
- Anderson S. T., Commins S., Moynagh P. N. & Coogan A. N. Lipopolysaccharide-induced sepsis induces long-lasting affective changes in the mouse. Brain. Behav. Immun. 43, 98–109 (2015). - PubMed
-
- Arbour N. C. et al. TLR4 mutations are associated with endotoxin hyporesponsiveness in humans. Nat. Genet. 25, 187–192 (2000). - PubMed
-
- Noreen M. et al. TLR4 polymorphisms and disease susceptibility. Inflamm. Res. 61, 177–188 (2012). - PubMed
Publication types
MeSH terms
Substances
LinkOut - more resources
Full Text Sources
Other Literature Sources
Research Materials
