Comparative Study
. 2016 Oct 3;11(10):e0159980.
doi: 10.1371/journal.pone.0159980. eCollection 2016.

Comparison of Confocal and Super-Resolution Reflectance Imaging of Metal Oxide Nanoparticles

Affiliations
Comparative Study

Comparison of Confocal and Super-Resolution Reflectance Imaging of Metal Oxide Nanoparticles

Emily J Guggenheim et al. PLoS One. .

Abstract

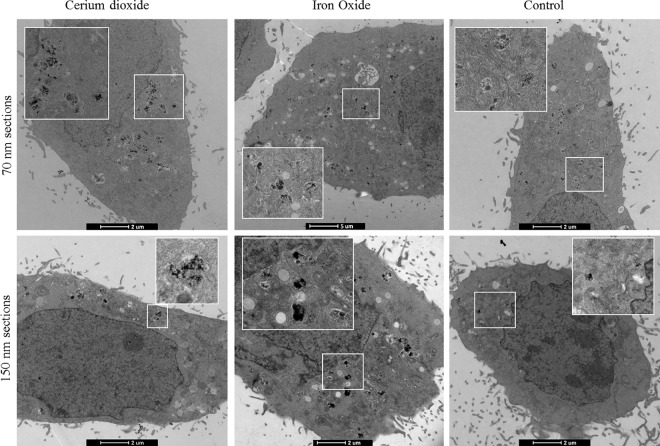
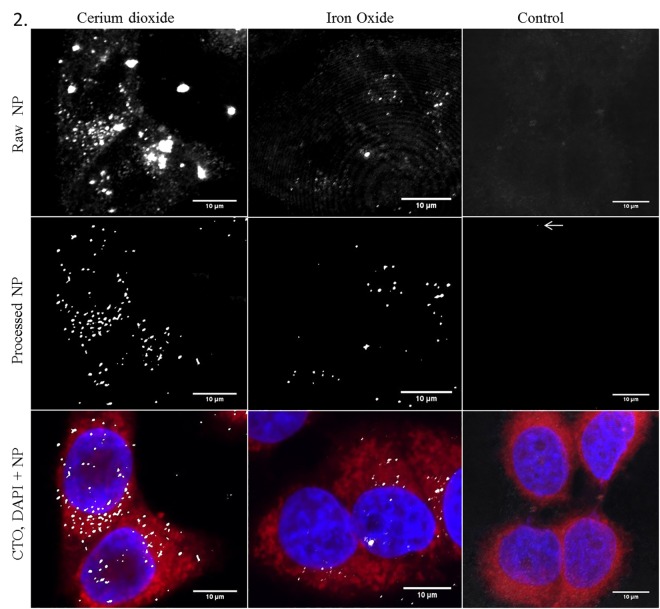
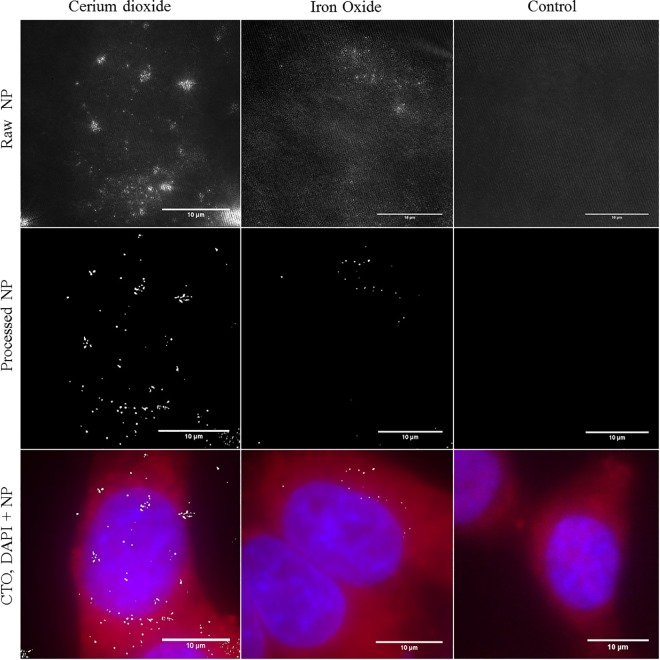
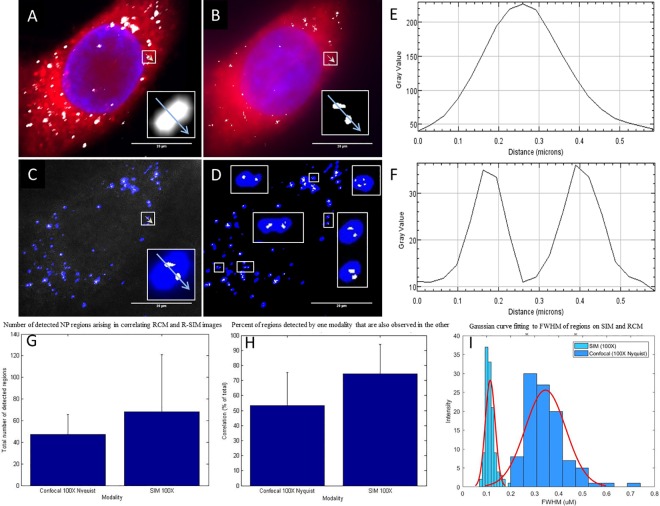
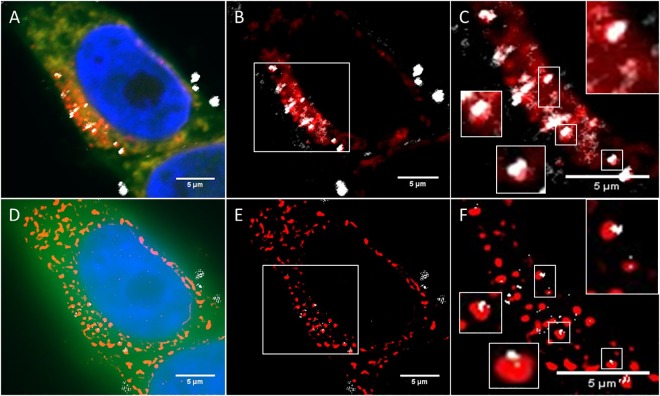
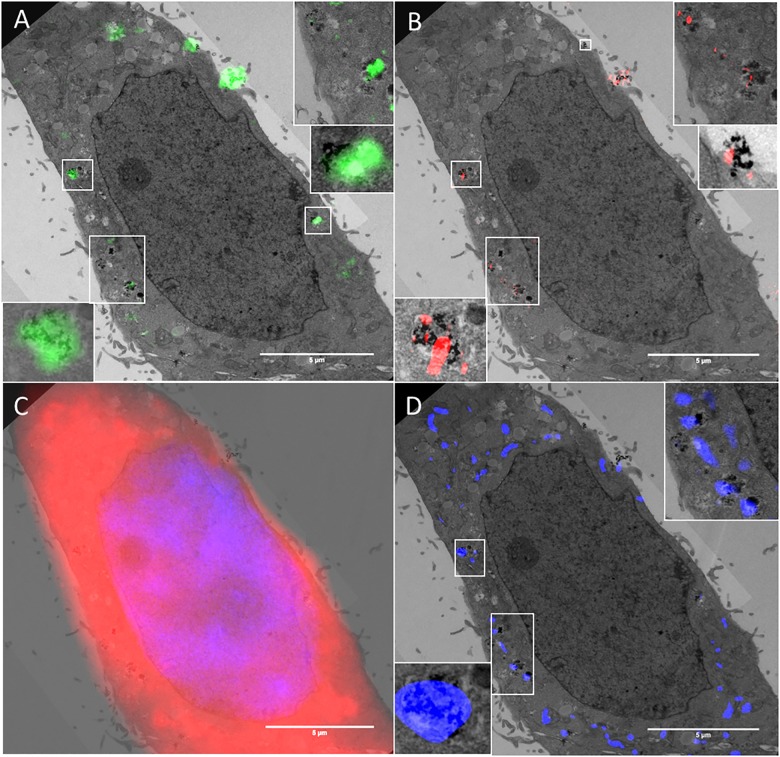
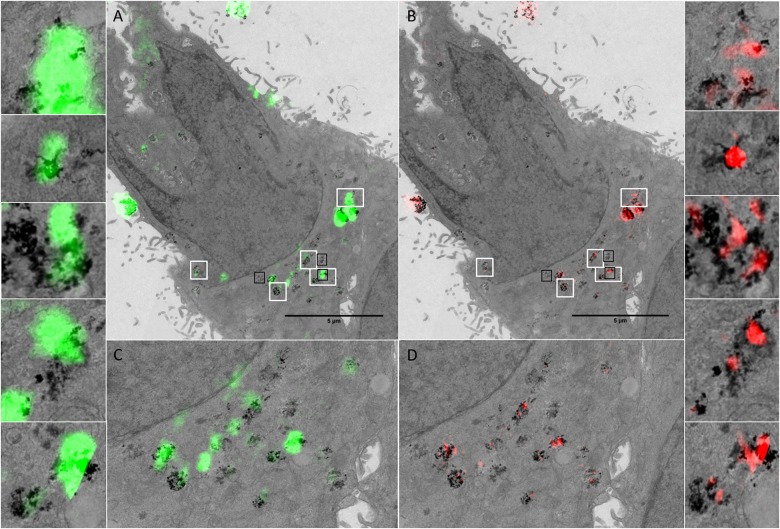
The potential for human exposure to manufactured nanoparticles (NPs) has increased in recent years, in part through the incorporation of engineered particles into a wide range of commercial goods and medical applications. NP are ideal candidates for use as therapeutic and diagnostic tools within biomedicine, however concern exists regarding their efficacy and safety. Thus, developing techniques for the investigation of NP uptake into cells is critically important. Current intracellular NP investigations rely on the use of either Transmission Electron Microscopy (TEM), which provides ultrahigh resolution, but involves cumbersome sample preparation rendering the technique incompatible with live cell imaging, or fluorescent labelling, which suffers from photobleaching, poor bioconjugation and, often, alteration of NP surface properties. Reflected light imaging provides an alternative non-destructive label free technique well suited, but not limited to, the visualisation of NP uptake within model systems, such as cells. Confocal reflectance microscopy provides optical sectioning and live imaging capabilities, with little sample preparation. However confocal microscopy is diffraction limited, thus the X-Y resolution is restricted to ~250 nm, substantially larger than the <100 nm size of NPs. Techniques such as super-resolution light microscopy overcome this fundamental limitation, providing increased X-Y resolution. The use of Reflectance SIM (R-SIM) for NP imaging has previously only been demonstrated on custom built microscopes, restricting the widespread use and limiting NP investigations. This paper demonstrates the use of a commercial SIM microscope for the acquisition of super-resolution reflectance data with X-Y resolution of 115 nm, a greater than two-fold increase compared to that attainable with RCM. This increase in resolution is advantageous for visualising small closely spaced structures, such as NP clusters, previously unresolvable by RCM. This is advantageous when investigating the subcellular trafficking of NP within fluorescently labelled cellular compartments. NP signal can be observed using RCM, R-SIM and TEM and a direct comparison is presented. Each of these techniques has its own benefits and limitations; RCM and R-SIM provide novel complementary information while the combination of modalities provides a unique opportunity to gain additional information regarding NP uptake. The use of multiple imaging methods therefore greatly enhances the range of NPs that can be studied under label-free conditions.


Conflict of interest statement

LC is an employee of Nikon Instruments. Although Nikon had no role in the funding or oversight of the studies presented, this could be indicative of an indirect COI. This does not alter our adherence to PLOS ONE policies on sharing data and materials.

Figures

Fig 1
Fig 1
Electron micrographs of A) cerium dioxide NPs, B) SPIONs, and C) Non-treated cells. The top panel depicts 70 nm ultrathin sections, the standard TEM mode, while the bottom panel uses 150 nm sections. Ultrathin and semi-thick sections can thus be successfully imaged. Thin sections give rise to a crisper image, with increased contrast visible at organelle boundaries. Thick sections have slightly less contrast due to the denser area being imaged but allow alignment with confocal slices (see below).
Fig 2
Fig 2. RCM allows visualisation of NP uptake within cancer cell models.
NP uptake can be visualised in HeLa cells treated with cerium dioxide NPs (65 cells) or SPIONs (51 cells) comparted to untreated control cells (25 cells). Images show maximum intensity Z-projections of cells stained with Cell Tracker Deep Red (CTDR) (red), 4’,6-diamdino-2phenylindeo (DAPI) nuclear stain (blue) and NP reflectance signal (grey). Control cells show no high intensity reflective spots. The raw intensity reflectance images show background reflectance in both control and treated cells (top panel). Following post processing, regions of high intensity signal are segmented from background signal (middle panel). Overlay of fluorescence stains and segmented reflectance NP signal (grey) (bottom panel).
Fig 3
Fig 3. R-SIM allows visualisation of NP uptake at increased resolution.
Reflectant signal was visualised in HeLa cells treated with cerium dioxide NPs (86 cells), SPIONs (32 cells) or untreated (25 cells). Images show maximum intensity Z-projections. Fluorescence images show conventional widefield epi-fluorescence of cells stained with CTDR (red) and DAPI nuclear stain (blue). Reflectance images show 2D SIM acquisition of reflectance NP signal (grey). Control cells show no high intensity reflective spots. The raw intensity reflectance images (top panel) show background reflectance in control and treated cells. Post processing and segmentation can isolate regions of high intensity reflectance (NPs) from background signal (middle panel). Overlay of cells stained with CTDR (red), DAPI nuclear stain (blue), and segmented reflectance NP signal (grey) (bottom panel).
Fig 4
Fig 4. Correlation of data obtained from RCM and SIM reflectance.
Maximum intensity Z-projection images of a HeLa cells treated with cerium dioxide NPs, acquired with RCM and R-SIM using identical 100X, 1.49 NA objective. RCM imaging volume is 3.6 μm and SIM 4 μm. Images A) (RCM) and B) (R-SIM) show CTDR (red) cytoplasmic stain, DAPI (blue) nuclear stain and NP signal (grey). Overlay of the cerium dioxide NP regions show particles detected in RCM (blue) and SIM (grey) in both the raw (C) and processed (D) images. White boxes display a sample of regions where RCM detects one spot and SIM detects multiple spots, illustrating the enhanced resolution of SIM. Intensity line scans of RCM (E) and R-SIM (F) show the decrease in peak width in SIM and the detection of two peaks where RCM detects one. The average total number of regions detected via each technique was computed (47 and 68 for RCM and R-SIM respectively) (G). The percentage of ‘regions’ or ‘connected components’ visualised with each modality, RCM and R-SIM, that are also seen in the other modality (54% and 74% respectively), were computed automatically using MATLAB as detailed in the methods section using 27 cells from multiple experiments performed on separate days (H). The means and STD are plotted. Comparison of the size distribution of the FWHM of 100 / 125 regions for RCM and R-SIM respectively are shown (I), with a fitted probability density function.
Fig 5
Fig 5. Colocalisation of NP signal with the lysosome following 24 hour NP incubation.
Single optical slice images of a HeLa cell treated with cerium dioxide NPs, acquired with RCM (A:C) and R-SIM (D:F). The theoretical slice thickness for RCM is ~480 nm. Theoretical optical slices for R-SIM are approximately the theoretical FWHM ~685 nm. Images A) (RCM) and B) (R-SIM) show CTDR (green) cytoplasmic stain, DAPI (blue) nuclear stain, LysoTracker Red DND-99 lyosomal stain (red) and NP signal (grey). Increased zoom of RCM (B:C) and R-SIM (E:F) show colocalisation of NP signal with fluorescent lysosomal signal (red). It is difficult to discern colocalisation with the RCM image; however the use of SIM provides proof of colocalisation in some cases (white boxes).
Fig 6
Fig 6. Cellular uptake and localisation of cerium dioxide NPs visualized by RCM, FCM, SIM and TEM.
Reflectance and TEM overlays of HeLa cells treated with cerium dioxide NPs. The ultrastructure of the cell is preserved and the sub-cellular localisation of NPs is evidenced by the lysosomal fluorescence stain (D). The TEM image has a section thickness of 150 nm. RCM overlay has a theoretical optical thickness of ~480 nm. R-SIM has an optical thickness of approximately the measured FWHMaxial which is 685 nm. Adjacent image sections were combined so that the thickness across modalities was as consistent as possible. Reflectance intensity arising in both RCM (A: Green) and SIM (B: Red) corresponds to regions detected by TEM. Overlays of DAPI nuclear and CTDR cytoplasmic stain (C) are shown. LysoTracker DND-99 stain (D: Blue) shows the localisation of detected NPs in lysosomes. White boxes show regions of correlation between all three modalities with increased magnification.
Fig 7
Fig 7. Cellular uptake and localisation of cerium dioxide NPs (Sigma-Aldrich) visualized by RCM, SIM and TEM.
Reflectance and TEM overlays of HeLa cells treated with cerium dioxide NPs. The cell outline in both TEM and reflectance microscopy is highly preserved, facilitating identification of the same cell. The ultrastructure of the cell is preserved and the sub-cellular vesicular localisation of NPs is evident. Individual NPs can be visualised at high magnification with TEM. RCM has a theoretical optical thickness of 480 nm. R-SIM has optical thickness approximated by the FWHMaxial calculated to be 685 nm. Adjacent image sections were combined so that the thickness across modalities was as consistent as possible. Reflectance intensity arising in both RCM (green; A and C) and SIM (red; B and D) correspond to regions detected by TEM. White boxes show regions of correlation between all three modalities with increased magnification. Black boxes show regions that are presented in S6 Fig.

References

    1. Handy RD, Owen R, Valsami-Jones E. The ecotoxicology of nanoparticles and nanomaterials: current status, knowledge gaps, challenges, and future needs. Ecotoxicology [Internet]. 2008. July [cited 2016 May 4];17(5):315–25. Available from: http://www.ncbi.nlm.nih.gov/pubmed/18408994 10.1007/s10646-008-0206-0 - DOI - PubMed
    1. Zhang J, Nazarenko Y, Zhang L, Calderon L, Lee K-B, Garfunkel E, et al. Impacts of a nanosized ceria additive on diesel engine emissions of particulate and gaseous pollutants. Environ Sci Technol [Internet]. 2013. November 19 [cited 2016 Mar 28];47(22):13077–85. Available from: http://www.pubmedcentral.nih.gov/articlerender.fcgi?artid=4066369&tool=p... 10.1021/es402140u - DOI - PMC - PubMed
    1. Smijs TG, Pavel S. Titanium dioxide and zinc oxide nanoparticles in sunscreens: focus on their safety and effectiveness. Nanotechnol Sci Appl [Internet]. 2011. January [cited 2016 May 4];4:95–112. Available from: http://www.pubmedcentral.nih.gov/articlerender.fcgi?artid=3781714&tool=p... 10.2147/NSA.S19419 - DOI - PMC - PubMed
    1. Forster SP, Olveira S, Seeger S. Nanotechnology in the market: promises and realities. Int J Nanotechnol [Internet]. Inderscience Publishers; 2011. May 20 [cited 2016 May 4]; Available from: http://www.inderscienceonline.com/doi/abs/10.1504/IJNT.2011.040193 - DOI
    1. Aitken RJ, Chaudhry MQ, Boxall ABA, Hull M. Manufacture and use of nanomaterials: current status in the UK and global trends. Occup Med (Lond) [Internet]. 2006. August [cited 2016 May 4];56(5):300–6. Available from: http://www.ncbi.nlm.nih.gov/pubmed/16868127 10.1093/occmed/kql051 - DOI - PubMed

Publication types

MeSH terms

LinkOut - more resources