

Limitations of turbidity process probes and formazine as their calibration standard
- PMID: 27695985
- PMCID: PMC5233748
- DOI: 10.1007/s00216-016-9893-1
Limitations of turbidity process probes and formazine as their calibration standard
Abstract
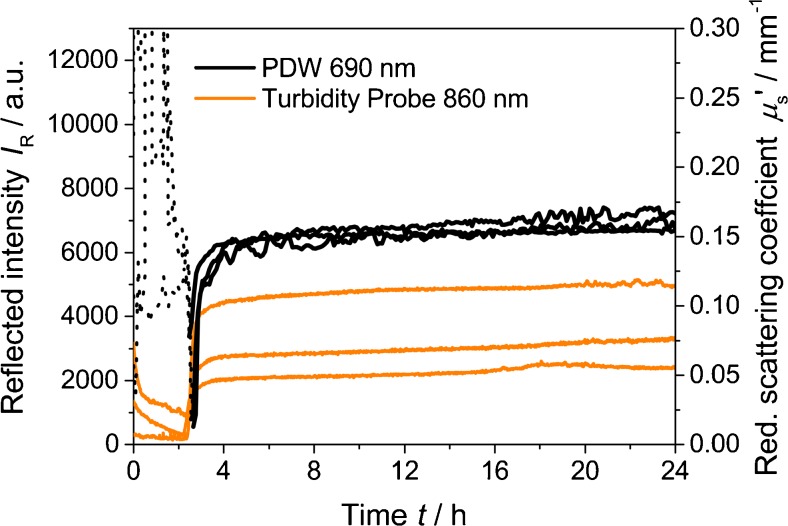
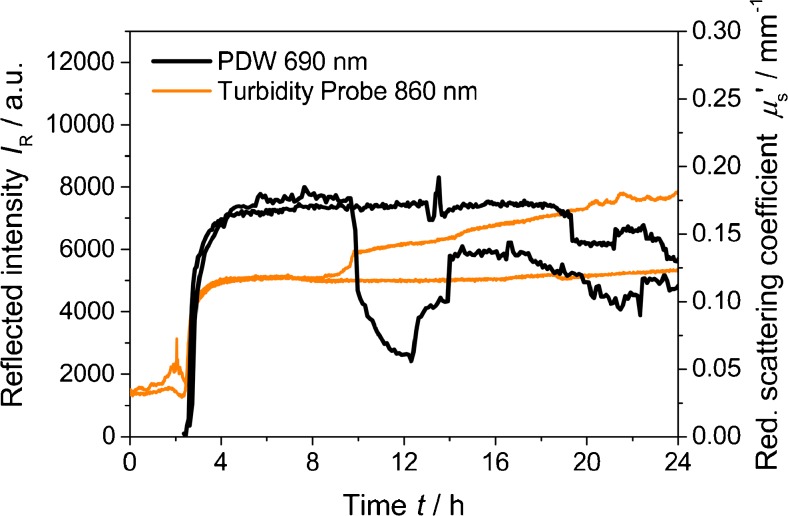
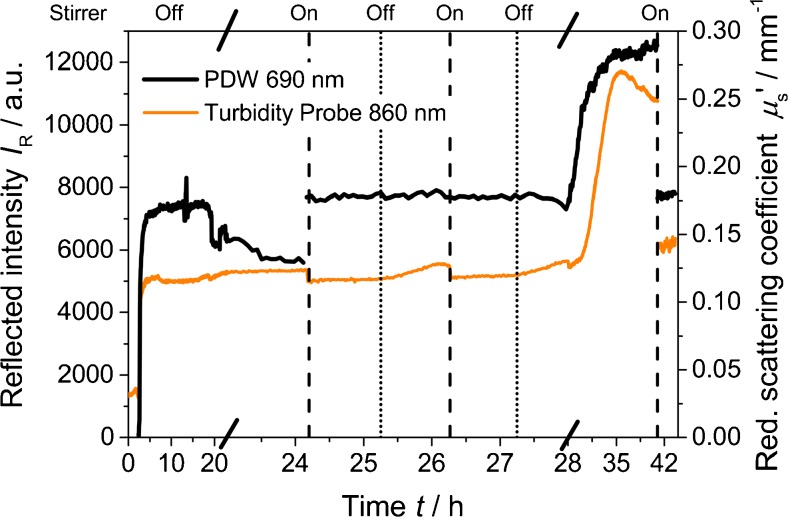
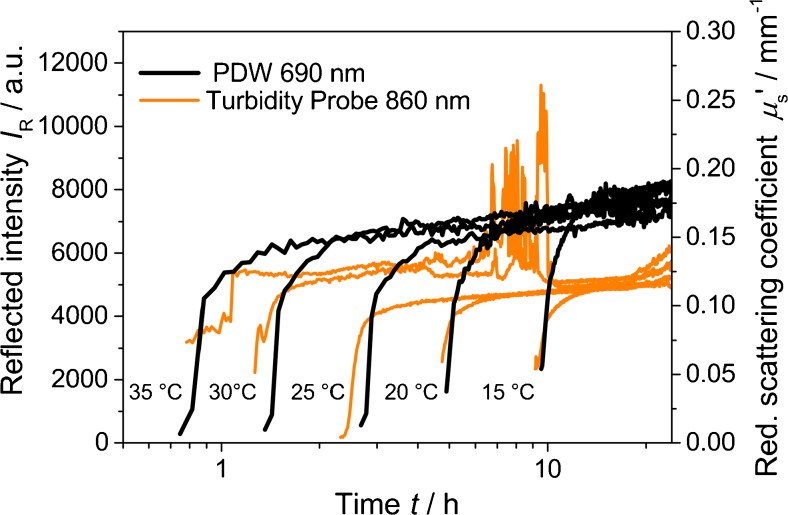
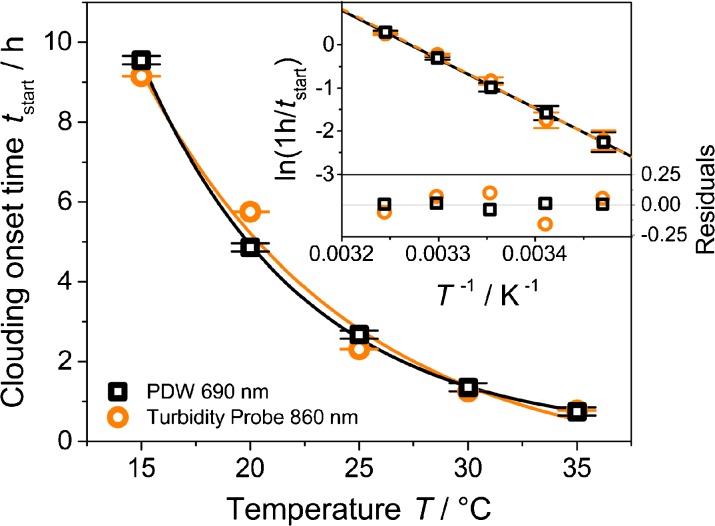
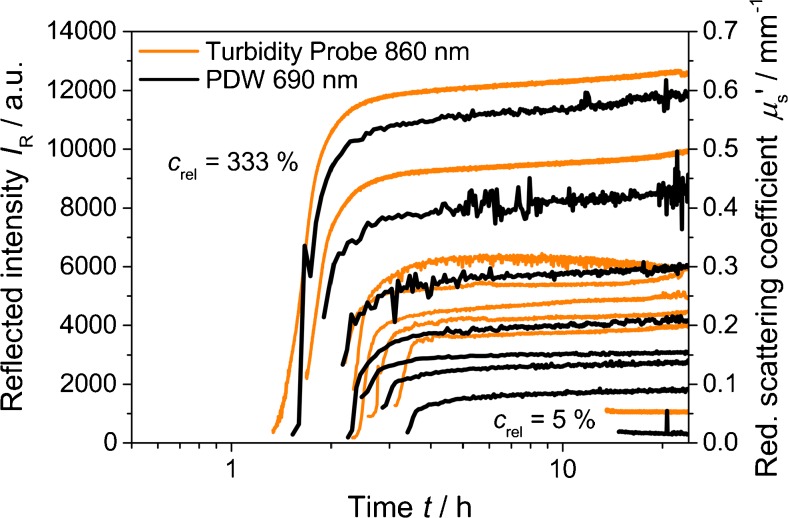
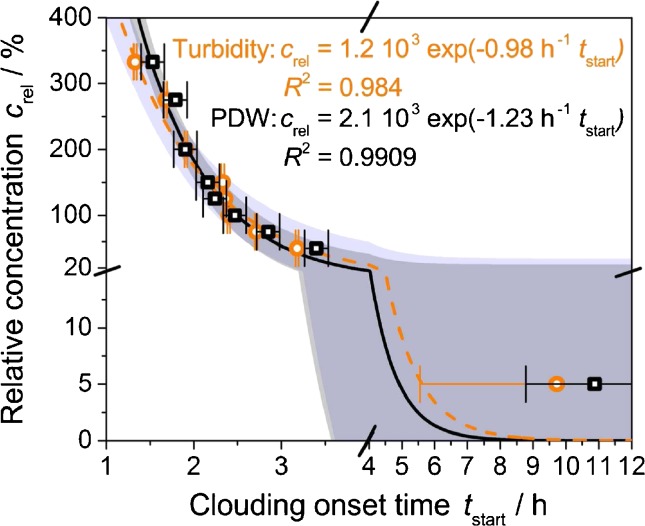
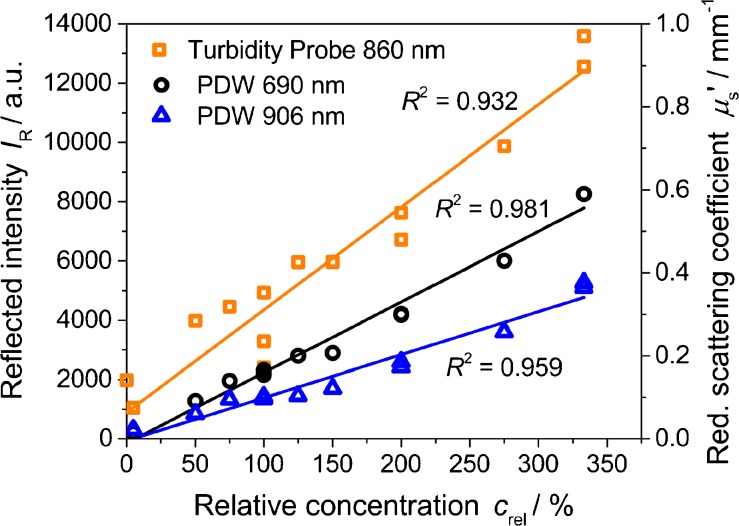
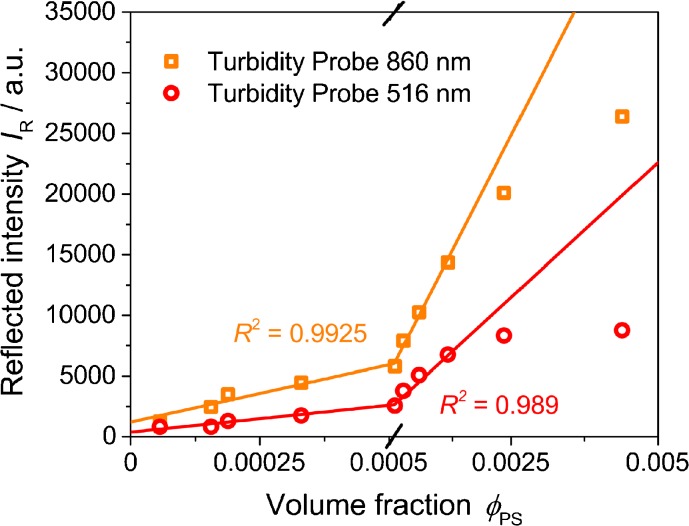
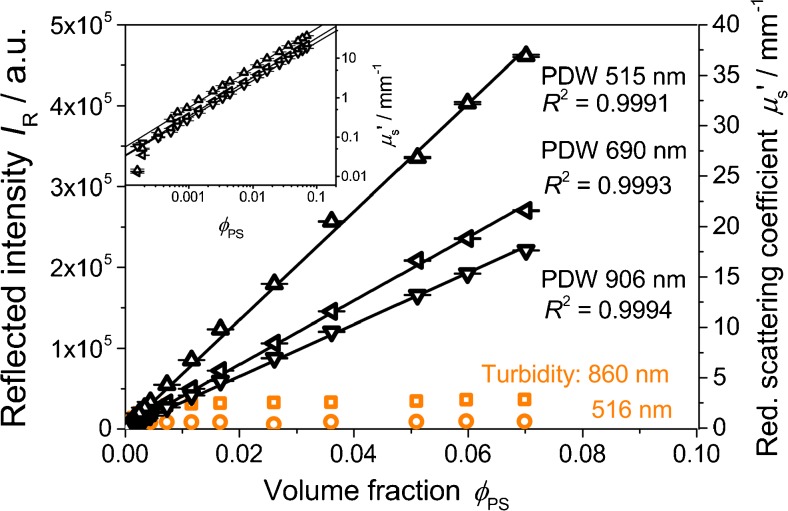
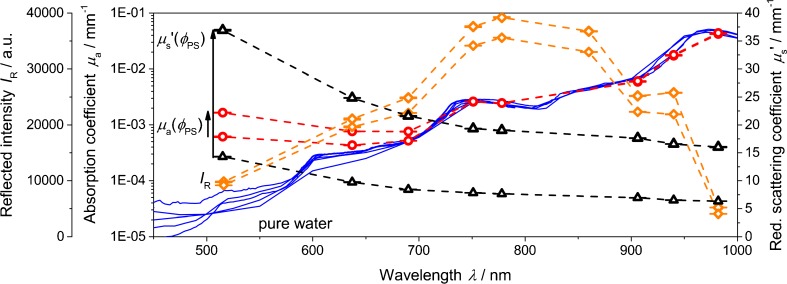
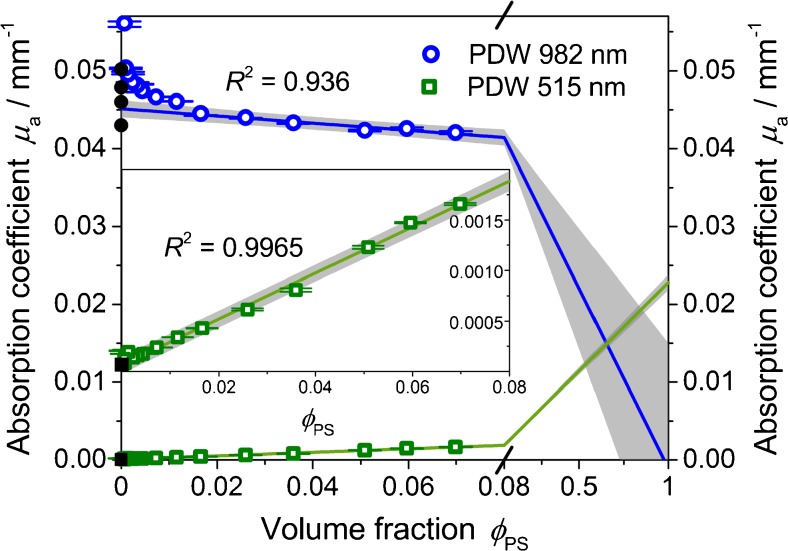
Turbidity measurements are frequently implemented for the monitoring of heterogeneous chemical, physical, or biotechnological processes. However, for quantitative measurements, turbidity probes need calibration, as is requested and regulated by the ISO 7027:1999. Accordingly, a formazine suspension has to be produced. Despite this regulatory demand, no scientific publication on the stability and reproducibility of this polymerization process is available. In addition, no characterization of the optical properties of this calibration material with other optical methods had been achieved so far. Thus, in this contribution, process conditions such as temperature and concentration have been systematically investigated by turbidity probe measurements and Photon Density Wave (PDW) spectroscopy, revealing an influence on the temporal formazine formation onset. In contrast, different reaction temperatures do not lead to different scattering properties for the final formazine suspensions, but give an access to the activation energy for this condensation reaction. Based on PDW spectroscopy data, the synthesis of formazine is reproducible. However, very strong influences of the ambient conditions on the measurements of the turbidity probe have been observed, limiting its applicability. The restrictions of the turbidity probe with respect to scatterer concentration are examined on the basis of formazine and polystyrene suspensions. Compared to PDW spectroscopy data, signal saturation is observed at already low reduced scattering coefficients.
Keywords: Calibration standard; Formazine; Photon Density Wave spectroscopy; Process analytical technology; Turbidity probes.
Conflict of interest statement
The authors declare that they have no conflict of interest.
Figures
References
-
- Kessler RW. Perspectives in process analysis. J Chemometrics. 2013;27:369–378. doi: 10.1002/cem.2549. - DOI
-
- Merkus HG, Meesters GMH. Particulate products: tailoring properties for optical Performance. Springer; 2014.
-
- Kim I, Kim Y, Lim HB. Turbidimetric measurement for on-line monitoring of SiO2 particles. B Korean Chem Soc. 2004;25:801–805. doi: 10.1007/BF02705523. - DOI
-
- Gippel CJ. The use of turbidimeters in suspended sediment research. Hydrobiologia. 1989;176:465–480. doi: 10.1007/BF00026582. - DOI
-
- Minella JPG, Merten GH, Reichert JM, Clarke RT. Estimating suspended sediment concentrations from turbidity measurements and the calibration problem. Hydrol Process. 2008;22:1819–1830. doi: 10.1002/hyp.6763. - DOI
LinkOut - more resources
Full Text Sources
Other Literature Sources
