

Blastomere biopsy for PGD delays embryo compaction and blastulation: a time-lapse microscopic analysis
- PMID: 27696105
- PMCID: PMC5125156
- DOI: 10.1007/s10815-016-0813-2
Blastomere biopsy for PGD delays embryo compaction and blastulation: a time-lapse microscopic analysis
Abstract
Purpose: The purpose of the study was to explore the effect of blastomere biopsy for preimplantation genetic diagnosis (PGD) on the embryos' dynamics, further cleavage, development, and implantation.
Methods: The study group included 366 embryos from all PGD treatments (September 2012 to June 2014) cultured in the EmbryoScope™ time-lapse monitoring system. The control group included all intracytoplasmic sperm injection (ICSI) embryos cultured in EmbryoScope™ until day 5 during the same time period (385 embryos). Time points of key embryonic events were analyzed with an EmbryoViewer™.
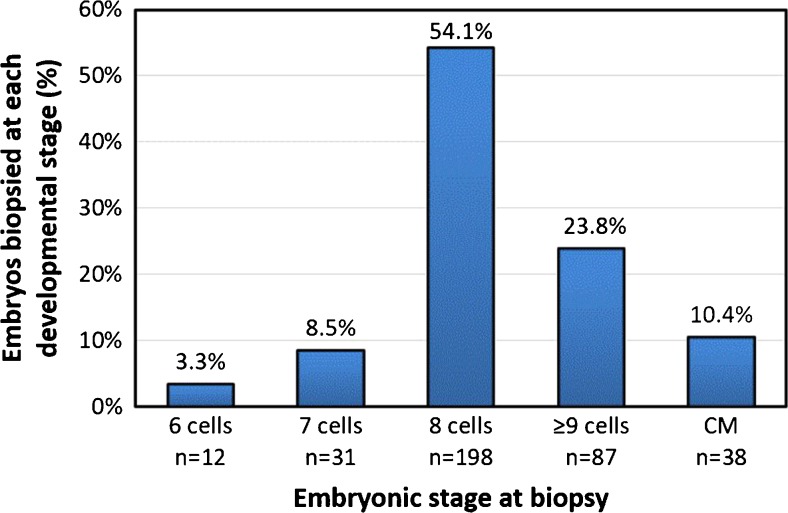
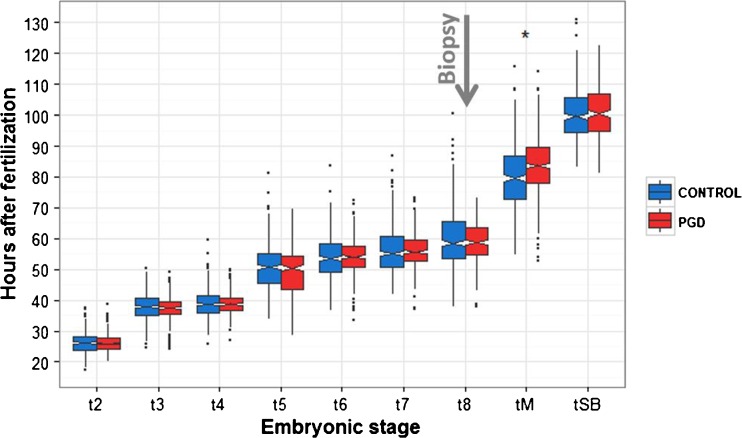
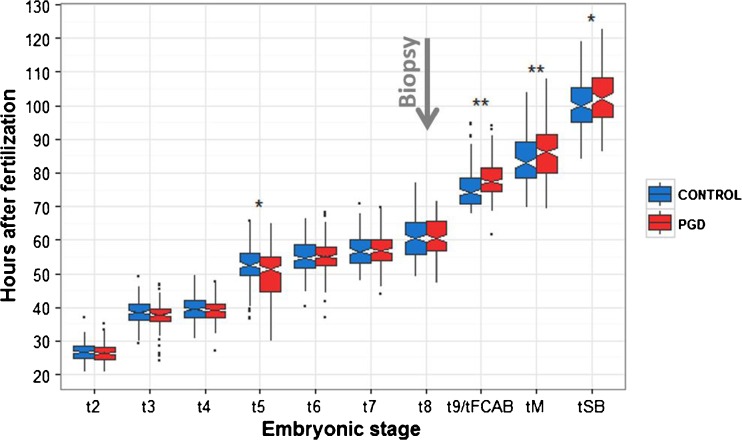
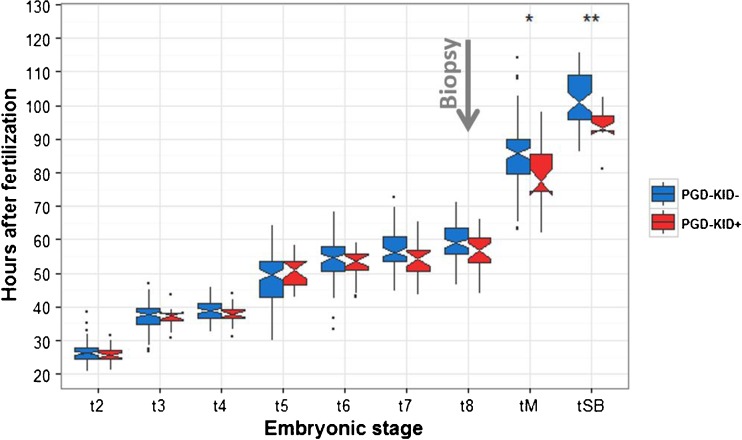
Results: Most (88 %) of the embryos were biopsied at ≥8 cells. These results summarize the further dynamic development of the largest cohort of biopsied embryos and demonstrate that blastomere biopsy of cleavage-stage embryos significantly delayed compaction and blastulation compared to the control non-biopsied embryos. This delay in preimplanation developmental events also affected postimplantation development as observed when the dynamics of non-implanted embryos (known implantation data (KID) negative) were compared to those of implanted embryos (KID positive).
Conclusion: Analysis of morphokinetic parameters enabled us to explore how blastomere biopsy interferes with the dynamic sequence of developmental events. Our results show that biopsy delays the compaction and the blastulation of the embryos, leading to a decrease in implantation.
Keywords: Blastomere biopsy; Embryo development; Morphokinetics; PGD; Time-lapse microscopy.
Figures
Similar articles
-
Optimal timing for blastomere biopsy of 8-cell embryos for preimplantation genetic diagnosis.Hum Reprod. 2018 Jan 1;33(1):32-38. doi: 10.1093/humrep/dex343. Hum Reprod. 2018. PMID: 29165686
-
Human embryonic development after blastomere removal: a time-lapse analysis.Hum Reprod. 2012 Jan;27(1):97-105. doi: 10.1093/humrep/der382. Epub 2011 Nov 10. Hum Reprod. 2012. PMID: 22081251
-
Modification of late human embryo development after blastomere removal on day 3 for preimplantation genetic testing.Syst Biol Reprod Med. 2021 Apr;67(2):121-126. doi: 10.1080/19396368.2020.1834008. Epub 2020 Nov 4. Syst Biol Reprod Med. 2021. PMID: 33148055
-
Preimplantation genetic diagnosis: state of the art.Eur J Obstet Gynecol Reprod Biol. 2009 Jul;145(1):9-13. doi: 10.1016/j.ejogrb.2009.04.004. Epub 2009 May 2. Eur J Obstet Gynecol Reprod Biol. 2009. PMID: 19411132 Review.
-
Embryo morphokinetic characteristics and euploidy.Curr Opin Obstet Gynecol. 2018 Jun;30(3):185-196. doi: 10.1097/GCO.0000000000000453. Curr Opin Obstet Gynecol. 2018. PMID: 29664791 Review.
Cited by
-
An Update on Non-invasive Approaches for Genetic Testing of the Preimplantation Embryo.Curr Genomics. 2022 Nov 18;23(5):337-352. doi: 10.2174/1389202923666220927111158. Curr Genomics. 2022. PMID: 36778192 Free PMC article. Review.
-
High-efficiency derivation of human embryonic stem cell lines using a culture system with minimized trophoblast cell proliferation.Stem Cell Res Ther. 2018 May 11;9(1):138. doi: 10.1186/s13287-018-0866-5. Stem Cell Res Ther. 2018. PMID: 29751777 Free PMC article.
-
Evolution of Minimally Invasive and Non-Invasive Preimplantation Genetic Testing: An Overview.J Clin Med. 2024 Apr 9;13(8):2160. doi: 10.3390/jcm13082160. J Clin Med. 2024. PMID: 38673433 Free PMC article. Review.
-
Good practice recommendations for the use of time-lapse technology†.Hum Reprod Open. 2020 Mar 19;2020(2):hoaa008. doi: 10.1093/hropen/hoaa008. eCollection 2020. Hum Reprod Open. 2020. PMID: 32206731 Free PMC article.
-
Diagnostic efficiency of blastocyst culture medium in noninvasive preimplantation genetic testing.F S Rep. 2020 Sep 15;2(1):88-94. doi: 10.1016/j.xfre.2020.09.004. eCollection 2021 Mar. F S Rep. 2020. PMID: 34223278 Free PMC article.
References
-
- Gutierrez-Mateo C, Sanchez-Garcia JF, Fischer J, Tormasi S, Cohen J, Munne S, et al. Preimplantation genetic diagnosis of single-gene disorders: experience with more than 200 cycles conducted by a reference laboratory in the United States. Fertil Steril. 2009;92(5):1544–1556. doi: 10.1016/j.fertnstert.2008.08.111. - DOI - PubMed
MeSH terms
LinkOut - more resources
Full Text Sources
Other Literature Sources
Miscellaneous
