. 2017 Mar;21(3):530-542.
doi: 10.1111/jcmm.12998. Epub 2016 Oct 3.

Severity of experimental traumatic brain injury modulates changes in concentrations of cerebral free amino acids

Affiliations

Severity of experimental traumatic brain injury modulates changes in concentrations of cerebral free amino acids

Angela Maria Amorini et al. J Cell Mol Med. 2017 Mar.

Abstract

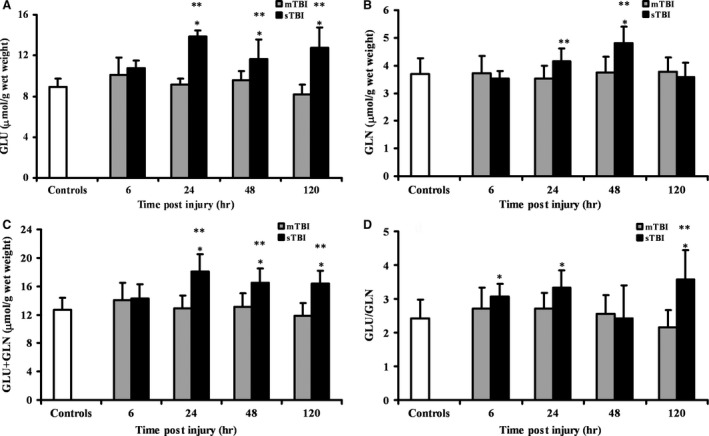
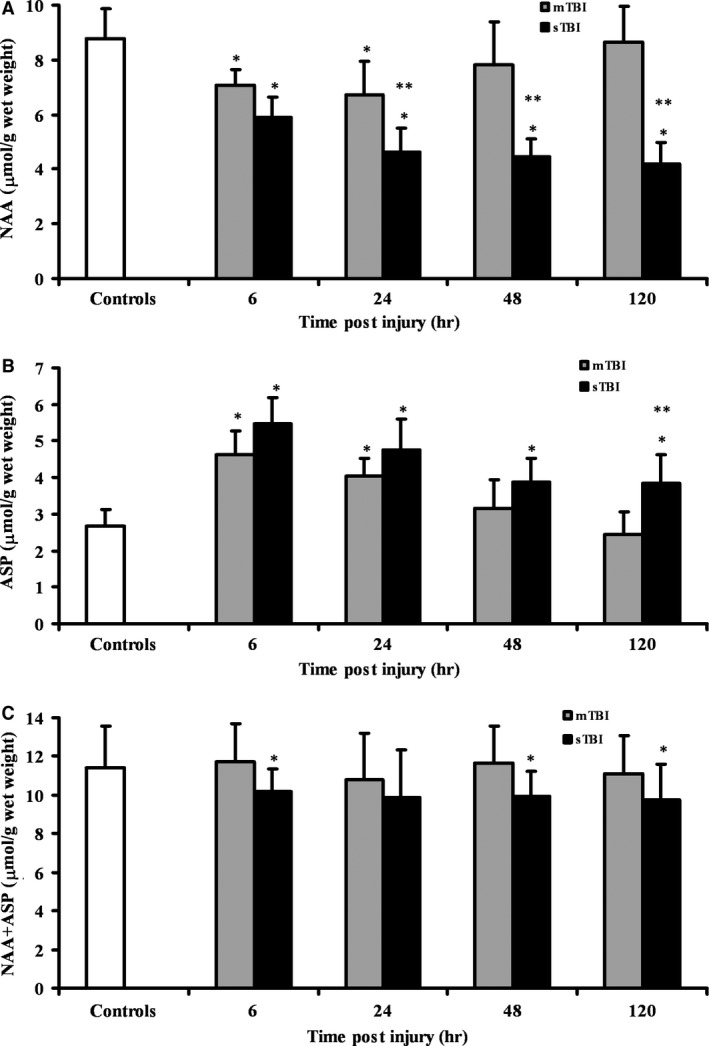
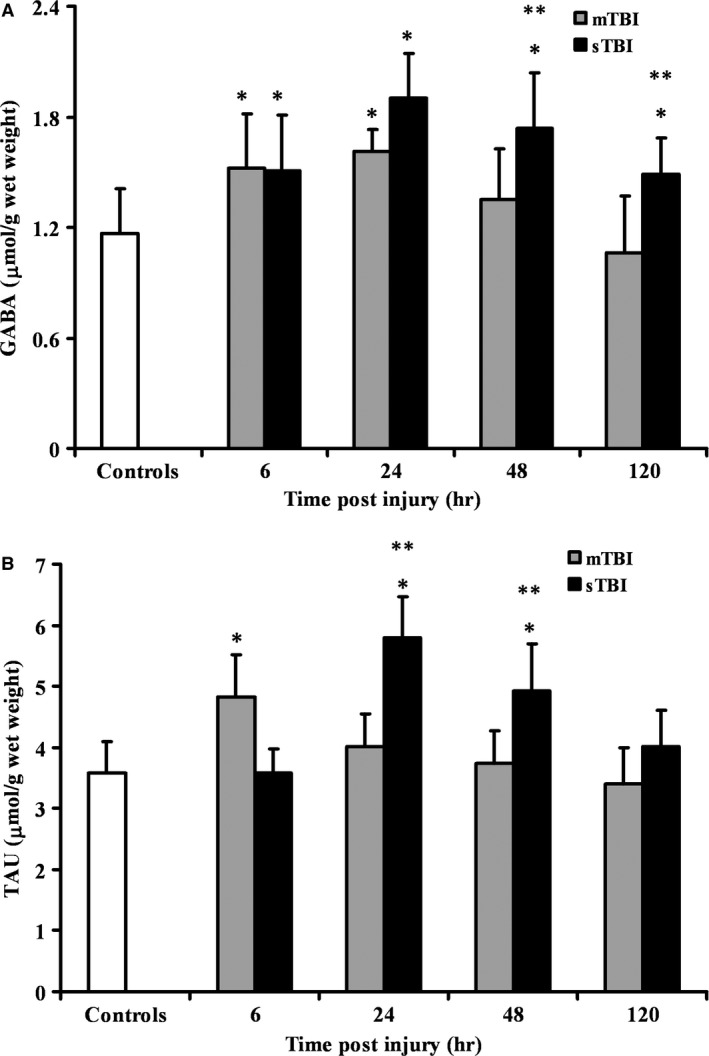
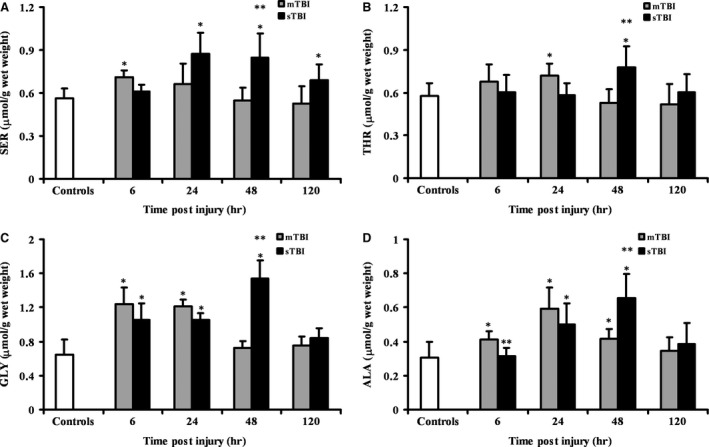
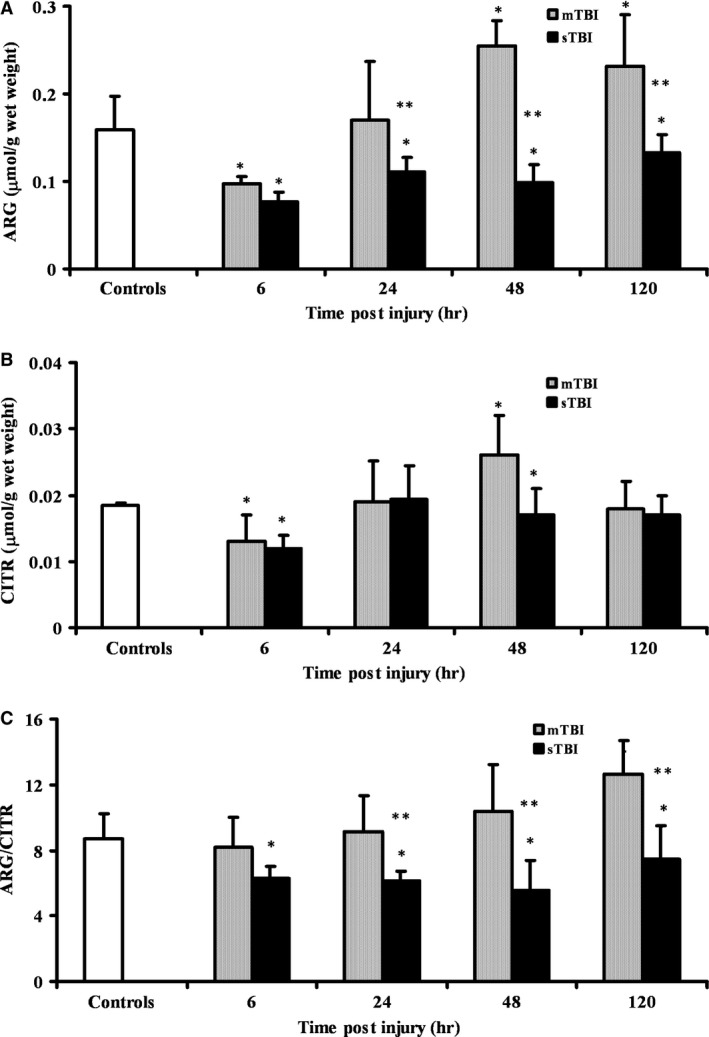
In this study, concentrations of free amino acids (FAA) and amino group containing compounds (AGCC) following graded diffuse traumatic brain injury (mild TBI, mTBI; severe TBI, sTBI) were evaluated. After 6, 12, 24, 48 and 120 hr aspartate (Asp), glutamate (Glu), asparagine (Asn), serine (Ser), glutamine (Gln), histidine (His), glycine (Gly), threonine (Thr), citrulline (Cit), arginine (Arg), alanine (Ala), taurine (Tau), γ-aminobutyrate (GABA), tyrosine (Tyr), S-adenosylhomocysteine (SAH), l-cystathionine (l-Cystat), valine (Val), methionine (Met), tryptophane (Trp), phenylalanine (Phe), isoleucine (Ile), leucine (Leu), ornithine (Orn), lysine (Lys), plus N-acetylaspartate (NAA) were determined in whole brain extracts (n = 6 rats at each time for both TBI levels). Sham-operated animals (n = 6) were used as controls. Results demonstrated that mTBI caused modest, transient changes in NAA, Asp, GABA, Gly, Arg. Following sTBI, animals showed profound, long-lasting modifications of Glu, Gln, NAA, Asp, GABA, Ser, Gly, Ala, Arg, Citr, Tau, Met, SAH, l-Cystat, Tyr and Phe. Increase in Glu and Gln, depletion of NAA and Asp increase, suggested a link between NAA hydrolysis and excitotoxicity after sTBI. Additionally, sTBI rats showed net imbalances of the Glu-Gln/GABA cycle between neurons and astrocytes, and of the methyl-cycle (demonstrated by decrease in Met, and increase in SAH and l-Cystat), throughout the post-injury period. Besides evidencing new potential targets for novel pharmacological treatments, these results suggest that the force acting on the brain tissue at the time of the impact is the main determinant of the reactions ignited and involving amino acid metabolism.

Keywords: N-acetylaspartate; cerebral free amino acids; excitotoxicity; high performance liquid chromatography; methyl-cycle; mild traumatic brain injury; severe traumatic brain injury.


Figures

Figure 1
Figure 1
Time course changes of cerebral concentrations of Glu (A), Gln (B), Glu + Gln (C) and Glu/Gln ratio (D) determined by HPLC in deproteinized tissue extracts of rats receiving mTBI or sTBI. Controls are represented by a group of sham operated rats (n = 6). Values at each time‐point are the mean of six animals (3 left + 3 right hemispheres). Standard deviations are represented by vertical bars. Tissue preparation, sample processing, pre‐column derivatization with OPA, and HPLC conditions for the separation of OPA‐amino acid adducts are fully described under Materials and Methods. *Significantly different from controls, P < 0.01. **Significantly different from corresponding time of mTBI rats, P < 0.05.
Figure 2
Figure 2
Time course changes of cerebral concentrations of NAA (A), Asp (B), and NAA + Asp (C) determined by HPLC in deproteinized tissue extracts of rats receiving mTBI or sTBI. Controls are represented by a group of sham operated rats (n = 6). Values at each time‐point are the mean of six animals (3 left + 3 right hemispheres). Standard deviations are represented by vertical bars. Tissue preparation, sample processing, pre‐column derivatization with OPA, and HPLC conditions for the separation of NAA and of OPA‐amino acid adducts are fully described under Materials and Methods. *Significantly different from controls, P < 0.01. **Significantly different from corresponding time of mTBI rats, P < 0.01.
Figure 3
Figure 3
Time course changes of cerebral concentrations of GABA (A), and Tau (B) determined by HPLC in deproteinized tissue extracts of rats receiving mTBI or sTBI. Controls are represented by a group of sham operated rats (n = 6). Values at each time‐point are the mean of six animals (3 left + 3 right hemispheres). Standard deviations are represented by vertical bars. Tissue preparation, sample processing, pre‐column derivatization with OPA, and HPLC conditions for the separation of OPA‐amino acid adducts are fully described under Materials and Methods. *significantly different from controls, P < 0.01. **significantly different from corresponding time of mTBI rats, P < 0.01.
Figure 4
Figure 4
Time course changes of cerebral concentrations of Ser (A), Thr (B), Gly (C) and Ala (D) determined by HPLC in deproteinized tissue extracts of rats receiving mTBI or sTBI. Controls are represented by a group of sham operated rats (n = 6). Values at each time‐point are the mean of six animals (3 left + 3 right hemispheres). Standard deviations are represented by vertical bars. Tissue preparation, sample processing, pre‐column derivatization with OPA, and HPLC conditions for the separation of OPA‐amino acid adducts are fully described under Materials and Methods. *Significantly different from controls, P < 0.05. **Significantly different from corresponding time of mTBI rats, P < 0.01.
Figure 5
Figure 5
Time course changes of cerebral concentrations of Arg (A), Citr (B), and Arg/Citr ratio (C) determined by HPLC in deproteinized tissue extracts of rats receiving mTBI or sTBI. Controls are represented by a group of sham operated rats (n = 6). Values at each time‐point are the mean of six animals (3 left + 3 right hemispheres). Standard deviations are represented by vertical bars. Tissue preparation, sample processing, pre‐column derivatization with OPA, and HPLC conditions for the separation of OPA‐amino acid adducts are fully described under Materials and Methods. *Significantly different from controls, P < 0.01. **Significantly different from corresponding time of mTBI rats, P < 0.01.

References

    1. Gundersen V, Storm‐Mathisen J, Bergersen LH. Neuroglial transmission. Physiol Rev. 2015; 95: 695–726. - PubMed
    1. Meunier CN, Dallérac G, Le Roux N, et al D‐serine and glycine differentially control neurotransmission during visual cortex critical period. PLoS ONE. 2016; doi:. - DOI - PMC - PubMed
    1. Sekine A, Okamoto M, Kanatani Y, et al Amino acids inhibit kynurenic acid formation via suppression of kynurenine uptake or kynurenic acid synthesis in rat brain in vitro. Springerplus. 2015; doi:. - DOI - PMC - PubMed
    1. Olsen GM, Sonnewald U. Glutamate: Where does it come from and where does it go? Neurochem Int. 2015; 88: 47–52. - PubMed
    1. Shnitko TA, Taylor SC, Stringfield SJ, et al Acute phenylalanine/tyrosine depletion of phasic dopamine in the rat brain. Psychopharmacology. 2016; 233: 2045–54. - PMC - PubMed

Publication types