. 2017 Mar;13(3):205-216.
doi: 10.1016/j.jalz.2016.08.005. Epub 2016 Sep 30.

Defining imaging biomarker cut points for brain aging and Alzheimer's disease

Affiliations

Defining imaging biomarker cut points for brain aging and Alzheimer's disease

Clifford R Jack Jr et al. Alzheimers Dement. 2017 Mar.

Abstract

Introduction: Our goal was to develop cut points for amyloid positron emission tomography (PET), tau PET, flouro-deoxyglucose (FDG) PET, and MRI cortical thickness.

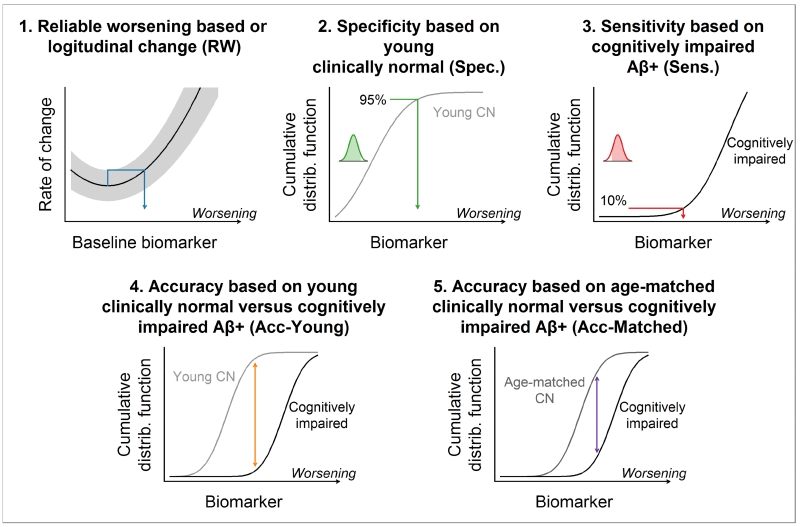
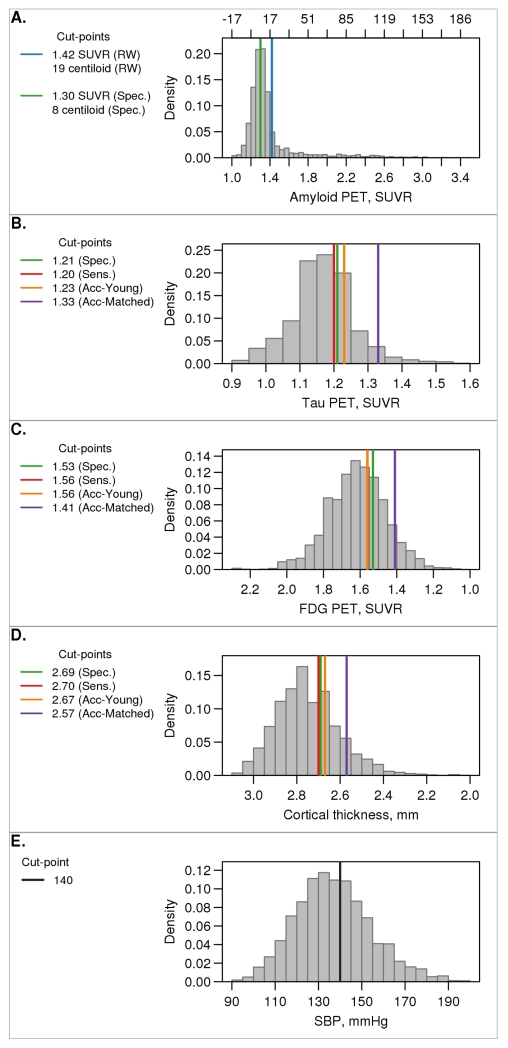
Methods: We examined five methods for determining cut points.

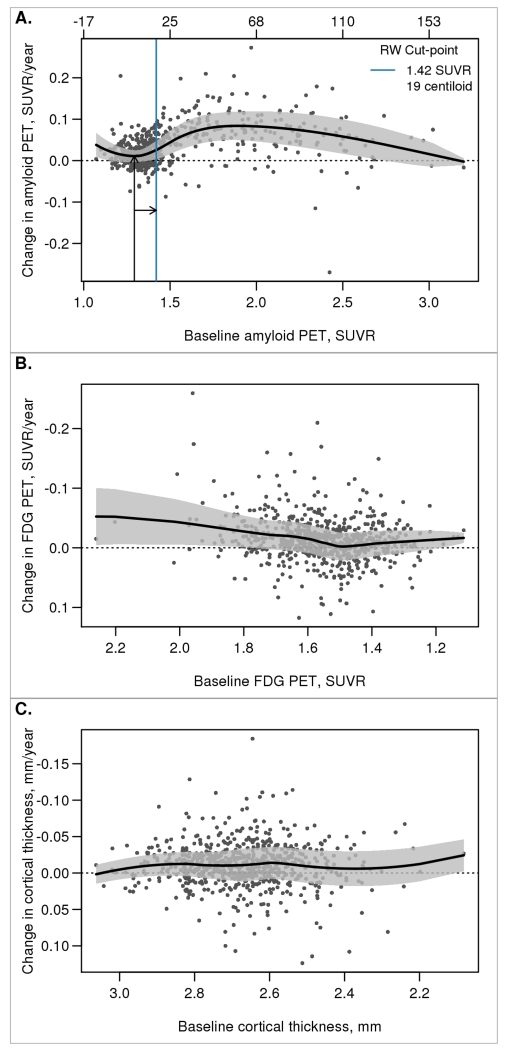
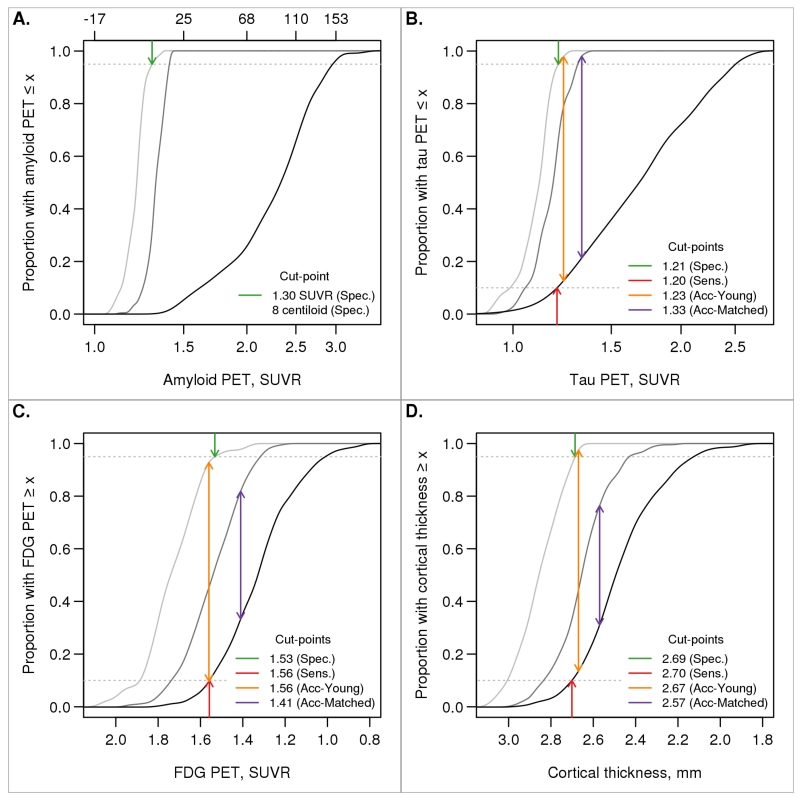
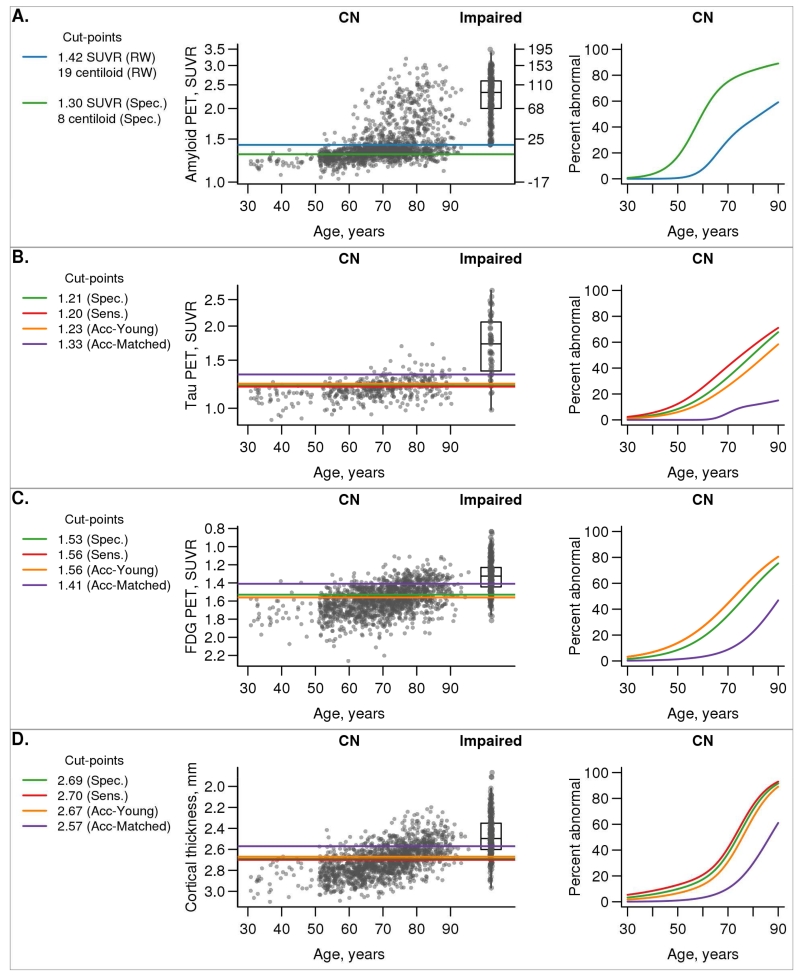
Results: The reliable worsening method produced a cut point only for amyloid PET. The specificity, sensitivity, and accuracy of cognitively impaired versus young clinically normal (CN) methods labeled the most people abnormal and all gave similar cut points for tau PET, FDG PET, and cortical thickness. Cut points defined using the accuracy of cognitively impaired versus age-matched CN method labeled fewer people abnormal.

Discussion: In the future, we will use a single cut point for amyloid PET (standardized uptake value ratio, 1.42; centiloid, 19) based on the reliable worsening cut point method. We will base lenient cut points for tau PET, FDG PET, and cortical thickness on the accuracy of cognitively impaired versus young CN method and base conservative cut points on the accuracy of cognitively impaired versus age-matched CN method.

Keywords: Alzheimer's MRI; Alzheimer's biomarkers; Alzheimer's disease; Alzheimer's imaging; Amyloid PET; FDG PET; Quantitative imaging; Tau PET.


Figures

Figure 1
Figure 1. Cut-point methods
Graphical summary of the five methods used for determining cut-points. In each panel, increasing numeric values of the biomarker correspond to biomarker worsening. A biomarker’s cumulative distribution function (CDF) indicates a biomarker value x on the horizontal axis and the proportion of observations less than or equal x on the vertical axis.
Figure 2
Figure 2. Reliable worsening cut-point
Scatter plot of annual rate of change in imaging biomarker versus baseline with a nonparametric scatter plot smoother line and a 50% prediction interval. For amyloid PET (panel A), the arrows and solid blue line illustrate how the reliable worsening (RW) cut-point was obtained. For this panel, values are shown in both SUVR and centiloid units. A reliable worsening cut-point was not obtained for FDG PET or MRI cortical thickness (panels B and C).
Figure 3
Figure 3. Specificity, sensitivity, and accuracy cut-points
Cumulative distribution function (CDF) plots for young CN individuals (light grey), cognitively impaired individuals (black), and older CN individuals that were age- and sex-matched to the cognitively impaired group (dark grey). The arrows indicate cut-points chosen corresponding to 95% specificity (CDF = 0.95, dark green arrow), 90% sensitivity (CDF = 0.10, dark red arrow), accuracy in discriminating between young CN and cognitively impaired individuals (orange arrow), and accuracy in discriminating between age-matched CN and cognitively impaired individuals (purple arrow). Accuracy was defined as the point of maximum difference between two CDFs. Amyloid PET was used in the definition of the cognitively impaired group so only the specificity cut-point is shown. For amyloid PET (panel A), values are shown in both SUVR and centiloid units.
Figure 4
Figure 4. Biomarkers vs age
Scatter plots of each biomarker versus age among all MCSA CN individuals with box plots of the cognitively impaired group shown for reference. The horizontal lines indicate cut-points chosen from the five methods. The colors used were as follows: reliable worsening (RW), blue (only in panel A); specificity (Spec.), green; sensitivity (Sens.), red; accuracy of cognitively impaired versus young CN (Acc-Young), orange; accuracy of cognitively impaired versus matched CN (Acc-Matched), purple. Using each of these five cut-point methods, we then label individuals as positive or negative and show the percent positive as estimated from logistic regression models. For amyloid PET (panel A), values are shown in both SUVR and centiloid units.
Figure 5
Figure 5. Distribution of biomarkers in MCSA sample
Histograms of the distribution of each biomarker (panels A-D) among all MCSA individuals aged 50-89 weighted to the Olmsted County population by age and sex. The horizontal lines indicate cut-points chosen from the five methods. The colors used were as follows: reliable worsening (RW), blue (panel A only); specificity (Spec.), green; sensitivity (Sens.), red; accuracy of cognitively impaired versus young CN (Acc-Young), orange; accuracy of cognitively impaired versus matched CN (Acc-Matched), purple. Systolic blood pressure is also shown in panel E with the cut-point of 140 mmHg (black line). For amyloid PET (panel A), values are shown in both SUVR and centiloid units.

References

    1. Sperling RA, Rentz DM, Johnson KA, Karlawish J, Donohue M, Salmon DP, et al. The A4 study: stopping AD before symptoms begin? Sci Transl Med. 2014;6:228fs13. - PMC - PubMed
    1. Hampel H, Schneider LS, Giacobini E, Kivipelto M, Sindi S, Dubois B, et al. Advances in the therapy of Alzheimer’s disease: targeting amyloid beta and tau and perspectives for the future. Expert Rev Neurother. 2015;15:83–105. - PubMed
    1. Dubois B, Feldman HH, Jacova C, Hampel H, Molinuevo JL, Blennow K, et al. Advancing research diagnostic criteria for Alzheimer’s disease: the IWG-2 criteria. Lancet Neurol. 2014;13:614–29. - PubMed
    1. Albert MS, DeKosky ST, Dickson D, Dubois B, Feldman HH, Fox NC, et al. The diagnosis of mild cognitive impairment due to Alzheimer’s disease: Recommendations from the National Institute on Aging and Alzheimer’s Association Workgroup. Alzheimers Dement. 2011;7:270–9. - PMC - PubMed
    1. Jack CR, Jr., Albert MS, Knopman DS, McKhann GM, Sperling RA, Carillo M, et al. Introduction to the recommendations from the National Institute on Aging-Alzheimer’s Association workgroups on diagnostic guidelines for Alzheimer’s disease. Alzheimers Dement. 2011;7:257–62. - PMC - PubMed

Substances