

Polyhydroxyalkanoate synthesis by mixed microbial consortia cultured on fermented dairy manure: Effect of aeration on process rates/yields and the associated microbial ecology
- PMID: 27697682
- PMCID: PMC5176644
- DOI: 10.1016/j.watres.2016.09.039
Polyhydroxyalkanoate synthesis by mixed microbial consortia cultured on fermented dairy manure: Effect of aeration on process rates/yields and the associated microbial ecology
Abstract
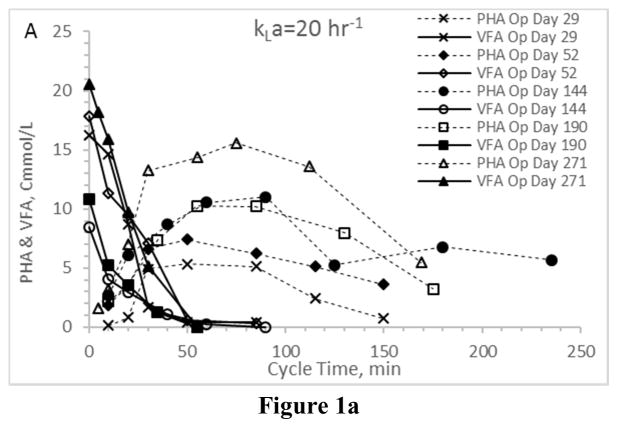
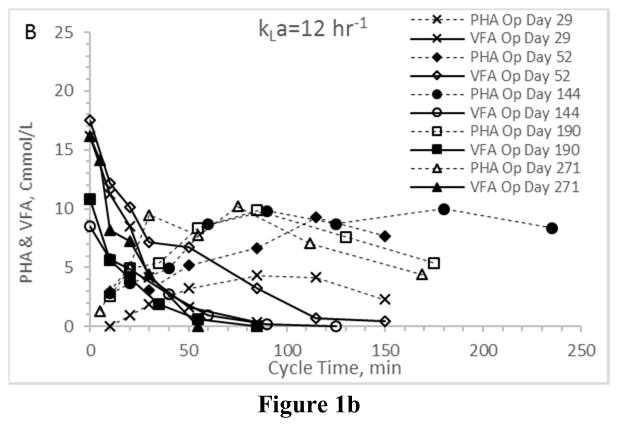
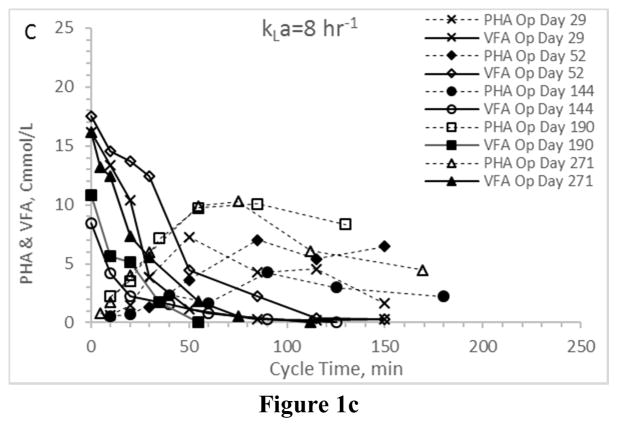
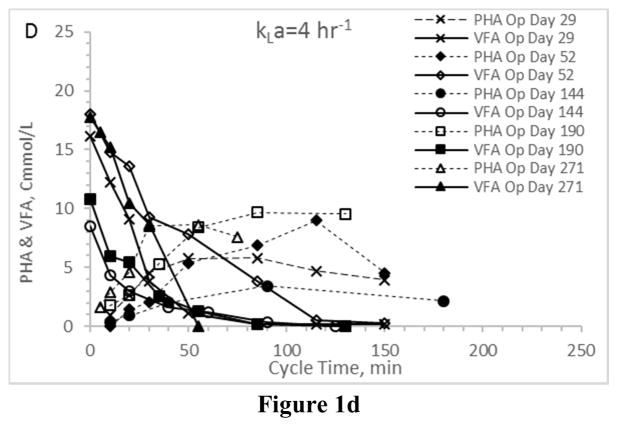
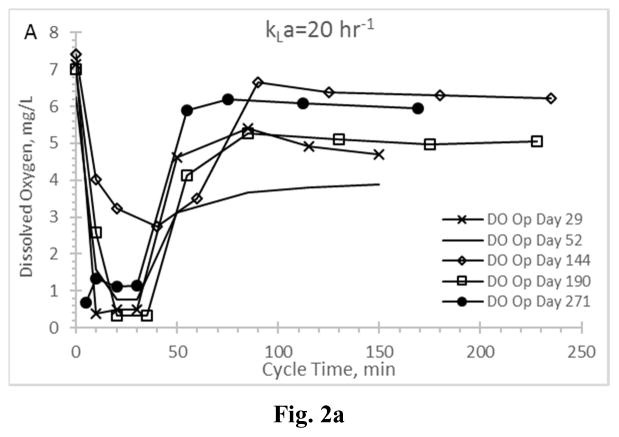
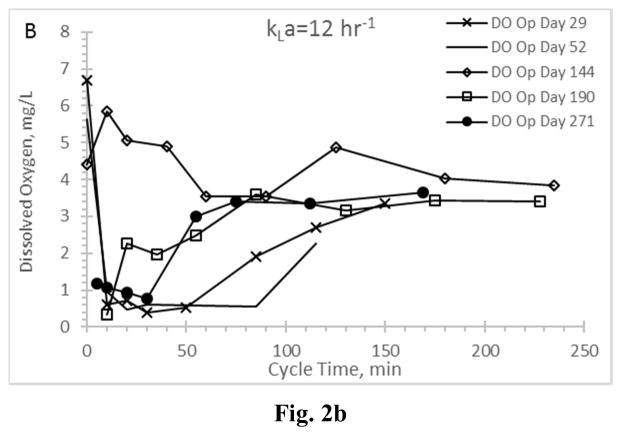
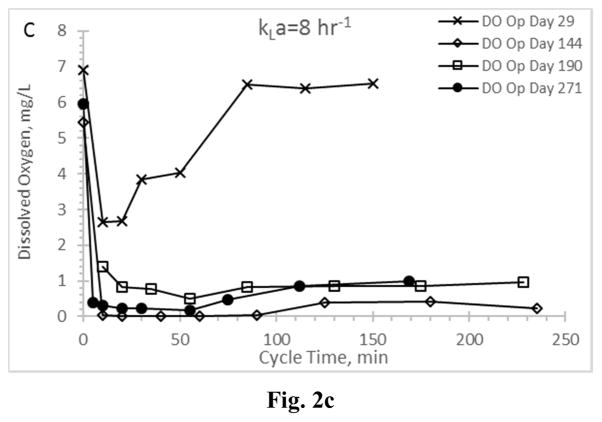
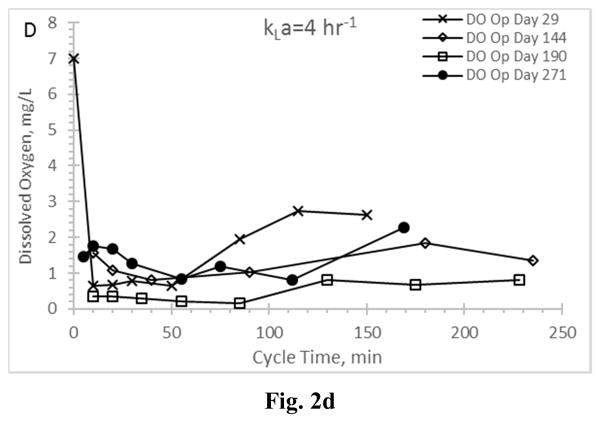
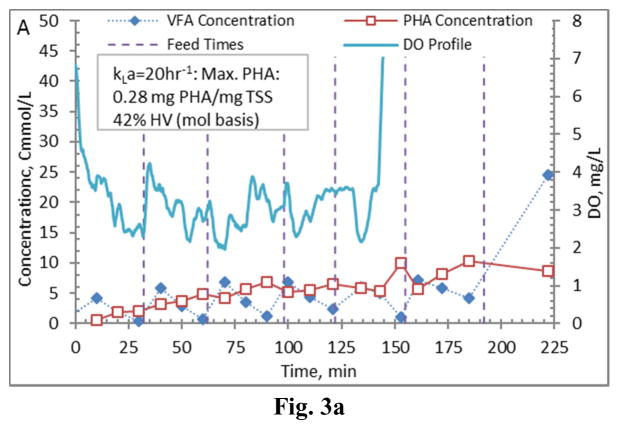
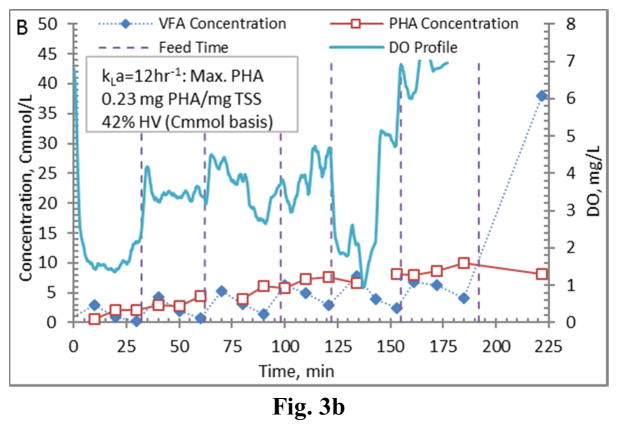
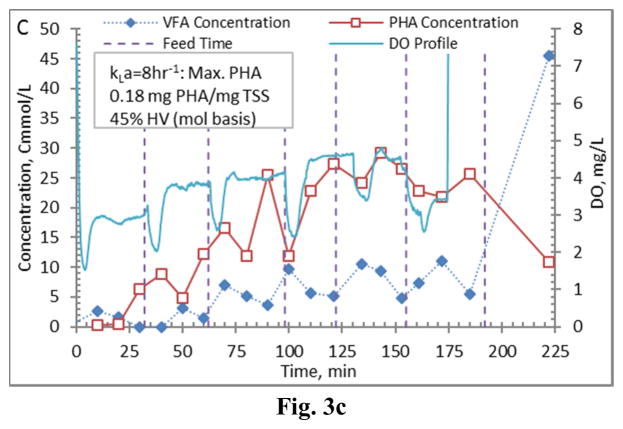
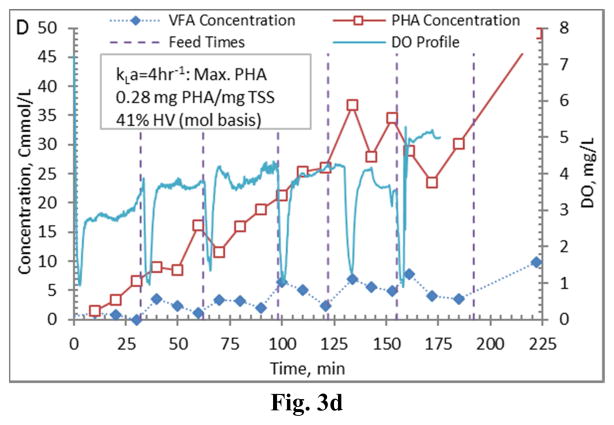
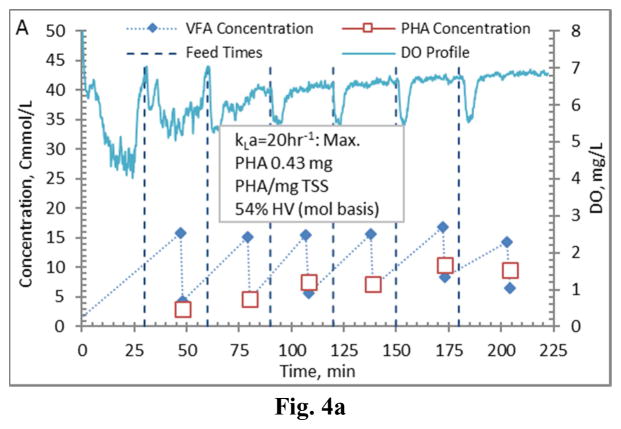
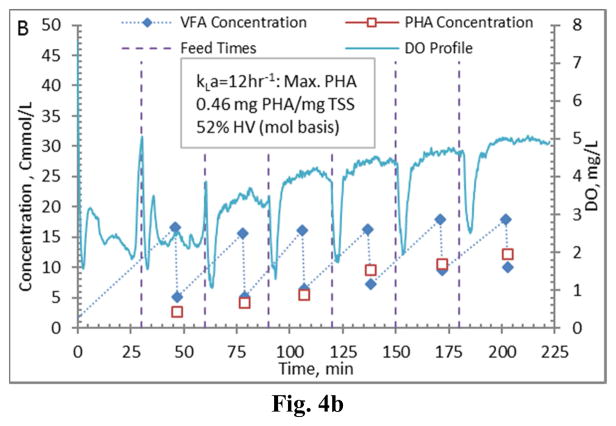
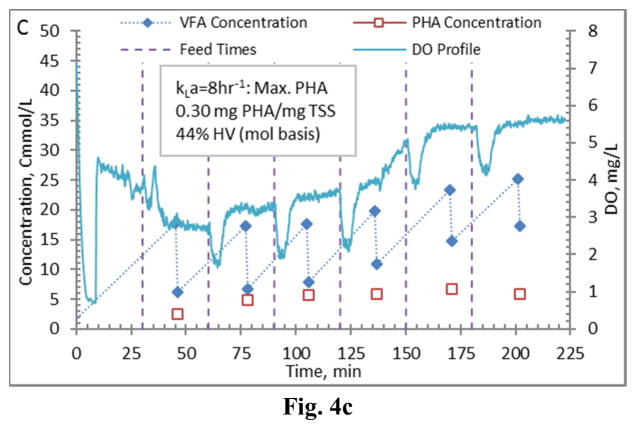
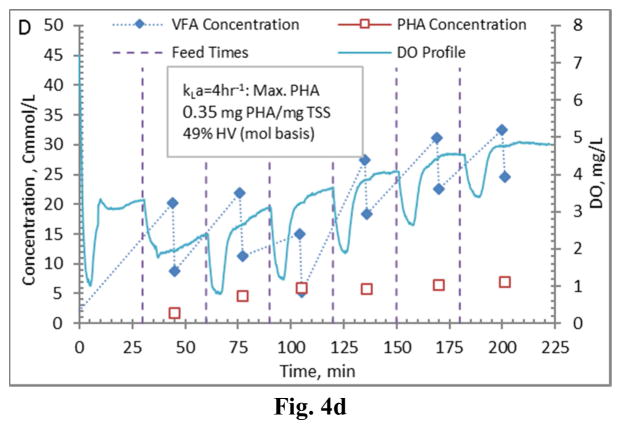
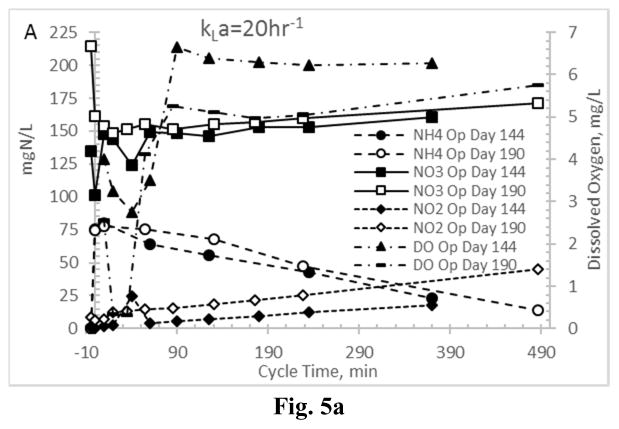
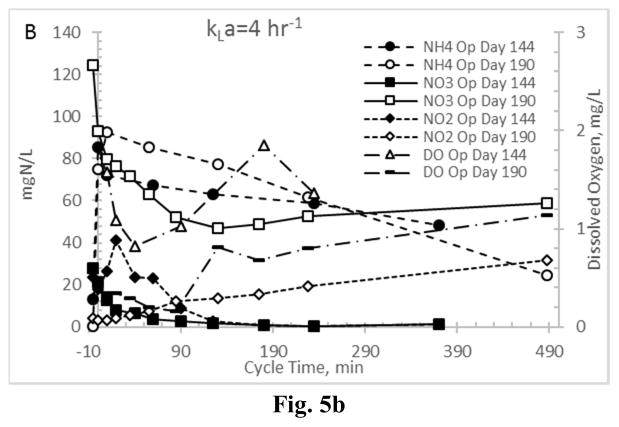
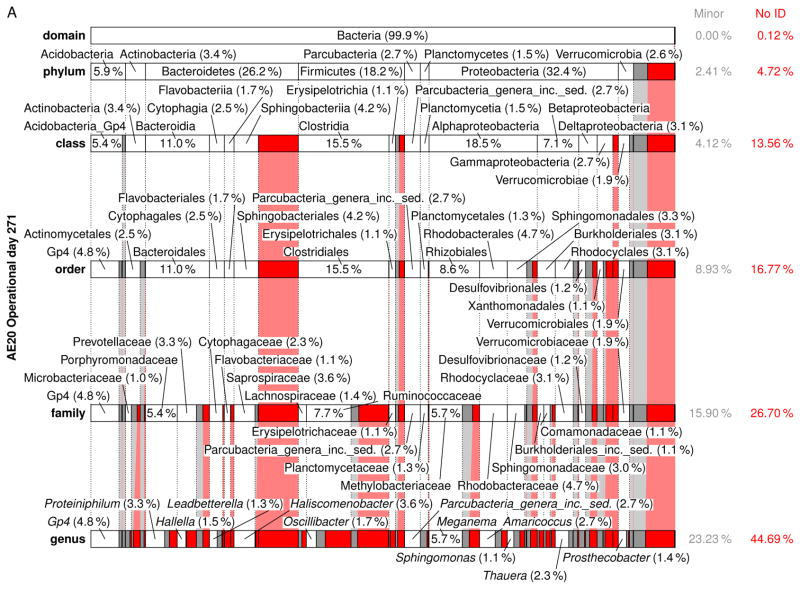
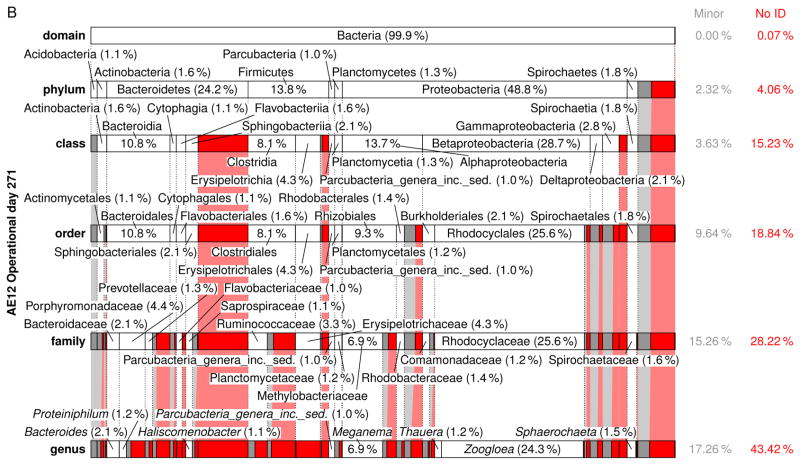
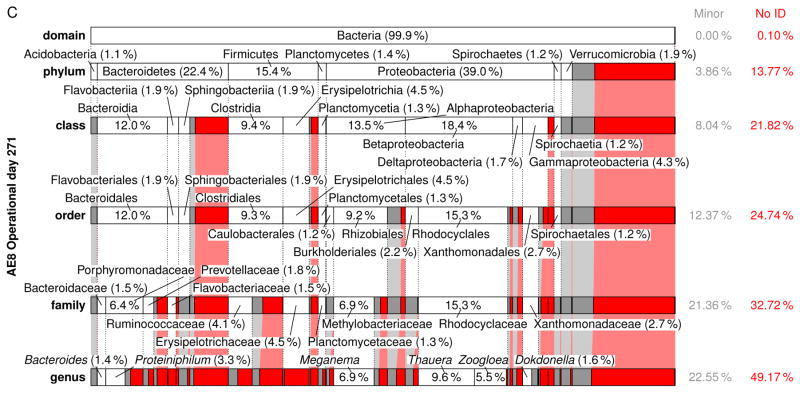
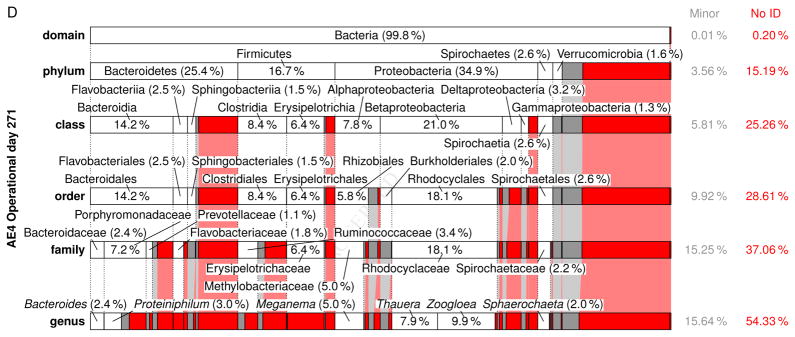
Polyhydroxyalkanoates (PHAs) are biodegradable polymers that can substitute for petroleum-based plastics in a variety of applications. One avenue to commercial PHA production involves coupling waste-based synthesis with the use of mixed microbial consortia (MMC). In this regard, production requires maximizing the enrichment of a MMC capable of feast-famine PHA synthesis, with the metabolic response induced through imposition of aerobic-dynamic feeding (ADF) conditions. However, the concept of PHA production in complex matrices remains unrefined; process operational improvements are needed, along with an enhanced understanding of the MMC. Research presented herein investigated the effect of aeration on feast-famine PHA synthesis, with four independent aeration state systems studied; MMC were fed volatile fatty acid (VFA)-rich fermented dairy manure. Regardless of the aeration state, all MMC exhibited a feast-famine response based on observed carbon cycling. Moreover, there was no statistical difference in PHA synthesis rates, with qPHA ranging from 0.10 to 0.19 CmmolPHA gVSS-1 min-1; VFA uptake rates exhibited similar statistical indifferences. PHA production assessments on the enriched MMC resulted in maximum intracellular concentrations ranging from 22.5 to 90.7% (mgPHA mgVSS-1); at maximum concentration, the mean hydroxyvalerate mol content was 73 ± 0.6%. While a typical feast-famine dissolved oxygen (DO) pattern was observed at maximum aeration, less resolution was observed at decreasing aeration rates, suggesting that DO may not be an optimal process monitoring parameter. At lower aeration states, nitrogen cycling patterns, supported by molecular investigations targeting AOBs and NOBs, indicate that NO2 and NO3 sustained feast-famine PHA synthesis. Next-generation sequencing analysis of the respective MMC revealed numerous and diverse genera exhibiting the potential to achieve PHA synthesis, suggesting functional redundancy embedded in the diverse MMC. Ultimately, results demonstrate that aeration can be controlled in waste-based ADF systems to sustain PHA production potential, while enriching for a diverse MMC that exhibits potential functional redundancy. Reduced aeration could also enhance cost competitiveness of waste-based PHA production, with potential further benefits associated with nitrogen treatment.
Keywords: ADF; Aerobic dynamic feeding; Next generation sequencing; Oxygen mass transfer coefficient; PHA; Polyhydroxyalkanoates; VFAs; Volatile fatty acids.
Copyright © 2016 Elsevier Ltd. All rights reserved.
Figures
Similar articles
-
Community proteomics provides functional insight into polyhydroxyalkanoate production by a mixed microbial culture cultivated on fermented dairy manure.Appl Microbiol Biotechnol. 2016 Sep;100(18):7957-76. doi: 10.1007/s00253-016-7576-7. Epub 2016 May 5. Appl Microbiol Biotechnol. 2016. PMID: 27147532
-
Strategies for efficiently selecting PHA producing mixed microbial cultures using complex feedstocks: Feast and famine regime and uncoupled carbon and nitrogen availabilities.N Biotechnol. 2017 Jul 25;37(Pt A):69-79. doi: 10.1016/j.nbt.2016.10.008. Epub 2016 Oct 25. N Biotechnol. 2017. PMID: 27793692
-
Polyhydroxyalkanoate (PHA) storage within a mixed-culture biomass with simultaneous growth as a function of accumulation substrate nitrogen and phosphorus levels.Water Res. 2015 Jun 15;77:49-63. doi: 10.1016/j.watres.2015.03.016. Epub 2015 Mar 24. Water Res. 2015. PMID: 25846983
-
Carbon recovery from wastewater through bioconversion into biodegradable polymers.N Biotechnol. 2017 Jul 25;37(Pt A):9-23. doi: 10.1016/j.nbt.2016.05.007. Epub 2016 Jun 8. N Biotechnol. 2017. PMID: 27288751 Review.
-
Recent advances in polyhydroxyalkanoate production by mixed aerobic cultures: from the substrate to the final product.Macromol Biosci. 2006 Nov 9;6(11):885-906. doi: 10.1002/mabi.200600112. Macromol Biosci. 2006. PMID: 17099863 Review.
Cited by
-
Insightful Advancement and Opportunities for Microbial Bioplastic Production.Front Microbiol. 2022 Jan 4;12:674864. doi: 10.3389/fmicb.2021.674864. eCollection 2021. Front Microbiol. 2022. PMID: 35058887 Free PMC article. Review.
-
Polyhydroxyalkanoates (PHAs): Biopolymers for Biofuel and Biorefineries.Polymers (Basel). 2021 Jan 13;13(2):253. doi: 10.3390/polym13020253. Polymers (Basel). 2021. PMID: 33451137 Free PMC article. Review.
-
The role of dissolved oxygen content as a modulator of microbial polyhydroxyalkanoate synthesis.World J Microbiol Biotechnol. 2018 Jul 3;34(8):106. doi: 10.1007/s11274-018-2488-6. World J Microbiol Biotechnol. 2018. PMID: 29971506 Review.
-
Impact of phosphorus limitation on medium-chain-length polyhydroxyalkanoate production by activated sludge.Appl Microbiol Biotechnol. 2023 Jun;107(11):3509-3522. doi: 10.1007/s00253-023-12528-x. Epub 2023 May 3. Appl Microbiol Biotechnol. 2023. PMID: 37133798
-
Rheological Behavior of High Cell Density Pseudomonas putida LS46 Cultures during Production of Medium Chain Length Polyhydroxyalkanoate (PHA) Polymers.Bioengineering (Basel). 2019 Oct 9;6(4):93. doi: 10.3390/bioengineering6040093. Bioengineering (Basel). 2019. PMID: 31600906 Free PMC article.
References
-
- Akiyama M, Tsuge T, Doi Y. Environmental life cycle comparison of polyhydroxyalkanoates produced from renewable carbon resources by bacterial fermentation. Polym Degrad Stabil. 2003;80(1):183–194.
-
- Albuquerque MGE, Torres CAV, Reis MAM. Polyhydroxyalkanoate (PHA) production by a mixed microbial culture using sugar molasses: Effect of the influent substrate concentration on culture selection. Water Res. 2010;44(11):3419–3433. - PubMed
-
- Anterrieu S, Quadri L, Geurkink B, Dinkla I, Bengtsson S, Arcos-Hernandez M, Alexandersson T, Morgan-Sagastume F, Karlsson A, Hjort M, Karabegovic L, Magnusson P, Johansson P, Christensson M, Werker A. Integration of biopolymer production with process water treatment at a sugar factory. New Biotechnol. 2014;31(4):308–323. - PubMed
-
- APHA, AWWA and WEF. Standard methods for the examination of water and wastewater. AWWA; 2012.
MeSH terms
Substances
Grants and funding
LinkOut - more resources
Full Text Sources
Other Literature Sources
Research Materials
Miscellaneous
