. 2016 Oct 10;215(1):37-46.
doi: 10.1083/jcb.201603108. Epub 2016 Oct 3.

Nanoscopic compartmentalization of membrane protein motion at the axon initial segment

Affiliations

Nanoscopic compartmentalization of membrane protein motion at the axon initial segment

David Albrecht et al. J Cell Biol. .

Abstract

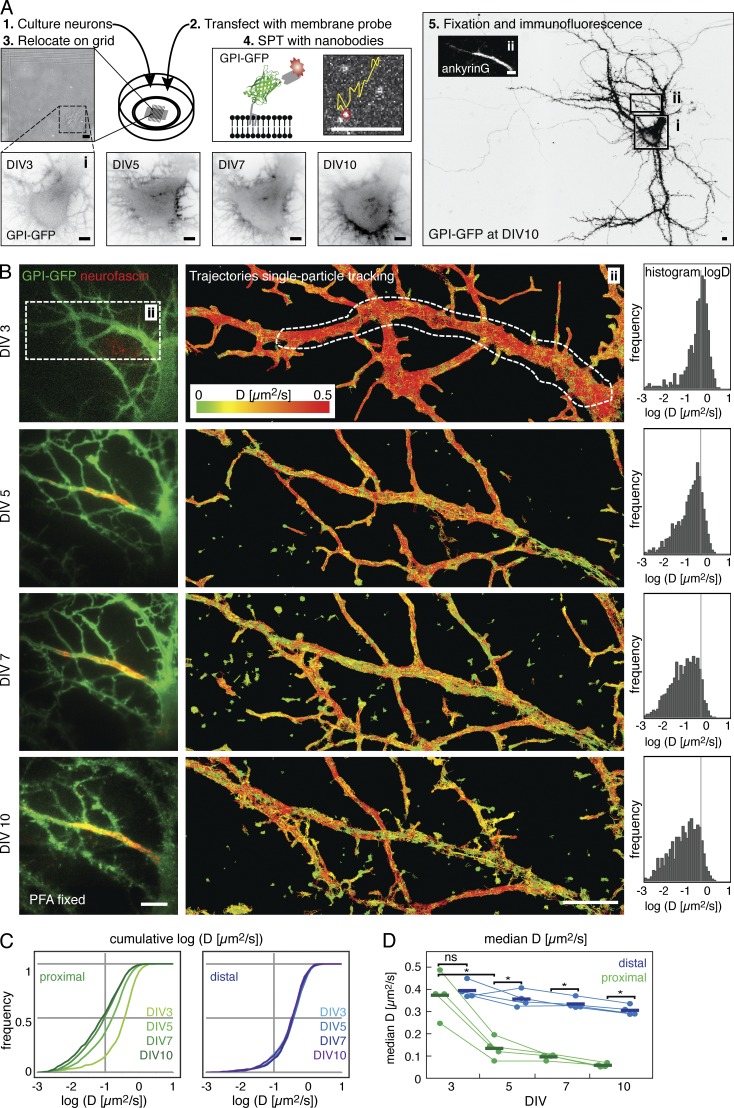
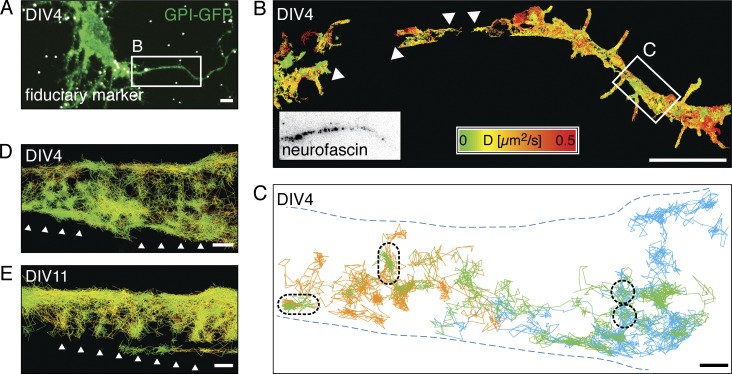
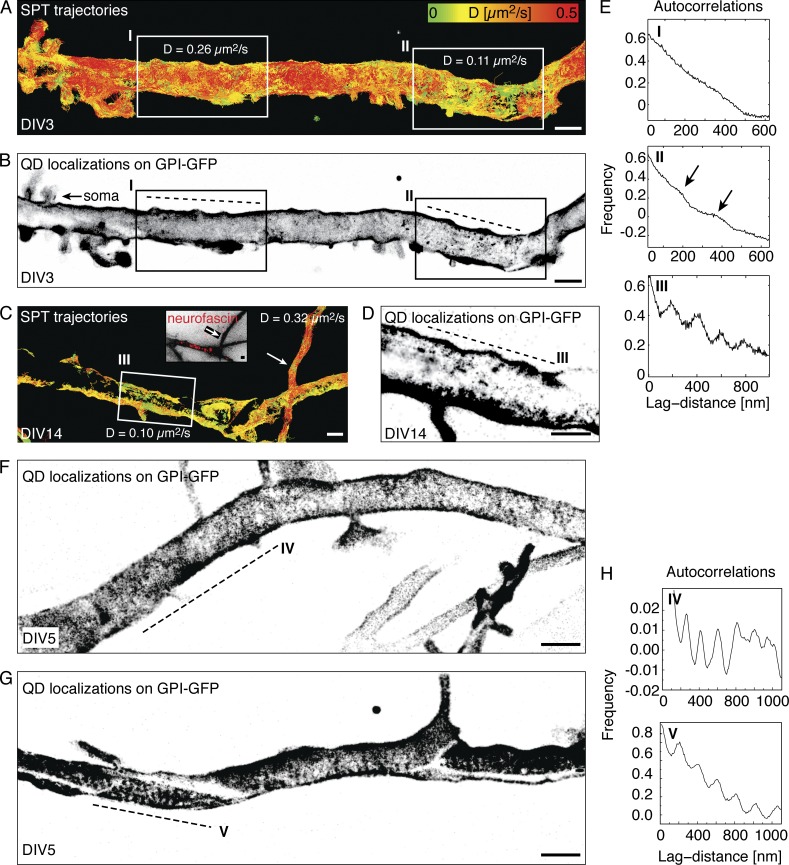
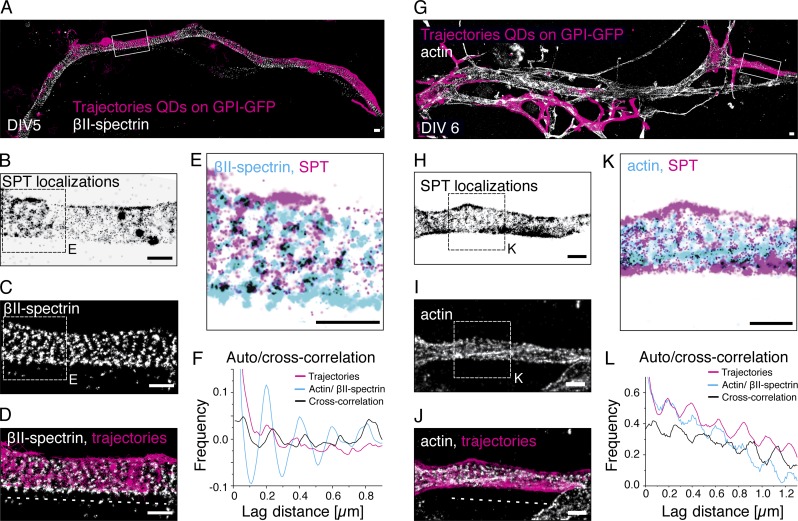
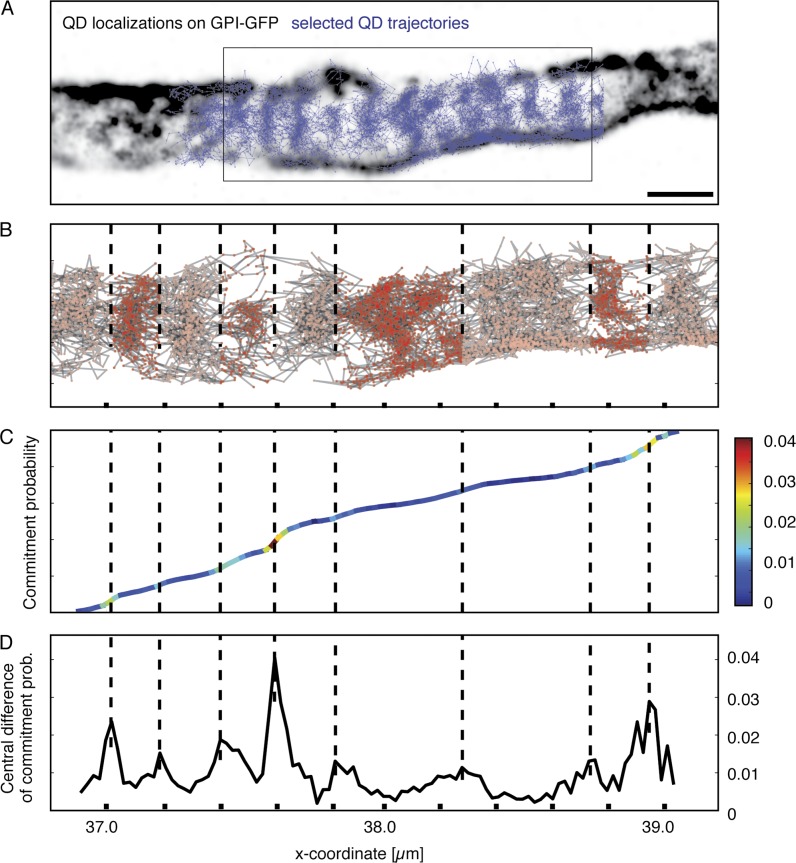
The axon initial segment (AIS) is enriched in specific adaptor, cytoskeletal, and transmembrane molecules. During AIS establishment, a membrane diffusion barrier is formed between the axonal and somatodendritic domains. Recently, an axonal periodic pattern of actin, spectrin, and ankyrin forming 190-nm-spaced, ring-like structures has been discovered. However, whether this structure is related to the diffusion barrier function is unclear. Here, we performed single-particle tracking time-course experiments on hippocampal neurons during AIS development. We analyzed the mobility of lipid-anchored molecules by high-speed single-particle tracking and correlated positions of membrane molecules with the nanoscopic organization of the AIS cytoskeleton. We observe a strong reduction in mobility early in AIS development. Membrane protein motion in the AIS plasma membrane is confined to a repetitive pattern of ∼190-nm-spaced segments along the AIS axis as early as day in vitro 4, and this pattern alternates with actin rings. Mathematical modeling shows that diffusion barriers between the segments significantly reduce lateral diffusion along the axon.


Figures

Figure 1.
Figure 1.
The diffusion of membrane molecules is restricted by DIV5 in hippocampal neurons. (A) Experimental design for the developmental time course in cultured primary hippocampal neurons. (1) Neurons were maintained in gridded glass-bottom Petri dishes and (2) transfected with the membrane-probe GPI-GFP. (3) Individual neurons were relocated on DIV3, 5, 7, and 10, respectively, based on their position on the grid. (4) Single-particle tracking (SPT) experiments were conducted by sparsely labeling transfected neurons with anti-GFP nanobodies conjugated to fluorescent organic dyes. (5) After SPT, neurons were fixed and immunostained for cytoskeletal and or AIS marker. The soma (i) and the proximal axon with the AIS (ii), identified by AnkG staining (inset micrograph), are outlined. (B) Results from the developmental SPT time course on a typical neuron. The AIS was identified by live immunolabeling of neurofascin. (left box) The proximal axon was neurofascin negative on DIV3 and neurofascin positive from DIV5 onwards. (middle box) Plot of trajectories of mobile particles tracked in SPT experiments color-coded for instantaneous diffusion coefficients D. (right box) Histogram of D on the proximal axon where the AIS assembles (white dashed line). Number of trajectories: DIV3, n = 787; DIV5, n = 1,815; DIV7, n = 2005; and DIV10, n = 1,067. (C) Plots of the cumulative D in the AIS (left, shades of green) and a portion of the distal axon (right, shades of blue) of the neuron shown in B. (D) Graph of the median D for all neurons (n = 4) between DIV3 and DIV10. Statistical analysis of median D by paired t test; *, P < 0.01; ns, not significant. Bars, 5 µm.
Figure 2.
Figure 2.
High-speed SPT shows that diffusing GPI-GFP molecules revisit small areas in the AIS. (A) Merged fluorescence micrograph of a DIV4 hippocampal neuron expressing GPI-GFP (green) after PFA fixation with fiduciary markers (white) for drift correction and image correlation. (B) Plot of SPT trajectories of anti-GFP nanobody-coupled quantum dots (n = 3,375) on GPI-GFP. Trajectories are color-coded according to the instantaneous diffusion coefficient. The AIS was identified by live immunolabeling of neurofascin (box). Not all areas were covered homogeneously by trajectories (arrowheads). (C) Plot of selected long trajectories (>500 steps, orange, green, and blue) along a segment with reduced lateral mobility (white box in B). The trajectories cover the axon inhomogeneously and show local zones, which are revisited by individual QDs (black dashed lines). (D) Same plot of area as in C, with all trajectories >20 steps plotted (n = 231) and color-coded according to the instantaneous diffusion coefficient as in B. Arrowheads emphasize a pattern emerging from the distribution of the trajectories. (E) Plot of trajectories of anti-GFP nanobody-coupled QDs on the AIS of a DIV11 neuron expressing GPI-GFP (n = 501). Trajectories are color coded as in B. Arrowheads emphasize an emergent pattern similar to that in D. Bars: (A and B) 5 µm; (C–E) 200 nm.
Figure 3.
Figure 3.
Accumulated positions of GPI-GFP molecules from SPT show a periodic pattern of ∼190 nm along the AIS that emerges as early as DIV3 during development. (A) Plot of SPT trajectories on the proximal axon of a DIV3 hippocampal neuron expressing GPI-GFP color-coded according to the instantaneous diffusion coefficient (D). Two areas are emphasized: one with a high (inset I) and one with a lower mean D (inset II). (B) Reconstructed image from all localizations acquired during SPT of QDs corresponding to the trajectories in A. (C) Trajectories color-coded for D on the proximal axon of a DIV 14 neuron. In a neurofascin-positive area (inset III), the lateral mobility is reduced compared with the distal axon that loops back to the neuron (arrow). The periodic pattern was observed directly on the AIS in DIV14 neurons. (D) Reconstructed image of all localizations from the SPT experiment in C. (E) Autocorrelations of localizations along the axon (dashed lines) reveal a periodicity of ∼190 nm emerging in areas of low D trajectories in insets II and III, but not in the area of high D in inset I. (F and G) A periodic pattern was observed along the entire proximal axon where the AIS is located but was usually more prominent in some regions (dashed line lines in IV and V). (H) Autocorrelations along segments IV and V show periodically arranged stripes of localizations. Bars, 1 µm.
Figure 4.
Figure 4.
The periodic confinement areas overlap with βII-spectrin immunostaining and are excluded from actin rings. (A) Proximal axon of a DIV5 hippocampal neuron with trajectories from SPT of GPI-GFP with QDs overlaid with a superresolution micrograph of βII-spectrin. (B) Reconstructed image of all localizations from SPT in the region of interest (white box, A) shows a regular pattern along the axis of the axon. (C) Superresolution micrograph of βII-spectrin confirms periodicity of the submembrane cytoskeleton in the region of interest. (D) Overlay of trajectories (magenta) and βII-spectrin (white). (E) Overlay of localizations from SPT (magenta) and cytoskeletal marker βII-spectrin (cyan). Regions where both overlap are black. (F) Auto- and cross-correlation along the axon (dashed line, D) confirms that both SPT localizations and βII-spectrin are arranged periodically at ∼190 nm. The cross-correlation places clusters of localizations from SPT on top of βII-spectrin with an offset of ∼25 nm. (G) Proximal axon of a DIV6 hippocampal neuron with trajectories from SPT of GPI-GFP with QDs overlaid with a superresolution micrograph of actin. (H) Reconstructed image of all localizations from SPT in region of interest (white box, G) shows a regular pattern along the axis of the axon. (I) Superresolution micrograph of actin confirms periodicity of the submembrane cytoskeleton in the region of interest. (J) Overlay of trajectories (magenta) and cytoskeletal marker actin (white). (K) Overlay of localizations from SPT (magenta) and cytoskeletal marker actin (cyan). Regions where both overlap are black. (L) Auto- and cross-correlation along the axon (J, dashed line) confirms that both SPT localizations and actin are arranged periodically at ∼190-nm spacing. The cross-correlation places clusters of localizations from SPT in between the actin rings with an offset of ∼20 nm. Bars, 500 nm.
Figure 5.
Figure 5.
The periodic confinement areas are separated by diffusion barriers. (A) Overlay of a reconstructed image of SPT localizations (black) on the AIS of a DIV5 neuron with trajectories (blue). The area selected for Markov model analysis is emphasized (box), and the model describes the diffusion from the left end to the right end of the area. (B) Plot of trajectories in area used for analysis and boundaries detected by the Markov model. x axis indicates distance, and tick marks are 200 nm. From the left, a ∼200-nm spacing of detected boundaries is apparent. As the pattern becomes more complex and is not perpendicular to axon propagation, boundaries are not as easily identified by the algorithm. (C) Plot of the commitment probability from the left to the right. The value corresponds to the local probability that a molecule will move to the right boundary rather than the left boundary next. Thus, the commitment probability indicates the progress of the transport process from left to right. In the case of pure random motion, a proportional increase in commitment would be detected along the axon. The slope of the graph is color-coded to emphasize local barriers detected as sudden changes in commitment between areas of proportional increase. (D) Plot of local change of the commitment probability. Peaks indicates positions where the commitment probability makes a step change and thus positions of dynamical boundaries (color-coded in C, corresponding to low-density regions in A and B).

References

    1. Albrecht D., Winterflood C.M., and Ewers H.. 2015. Dual color single particle tracking via nanobodies. Methods Appl. Fluoresc. 3:1–8. 10.1088/2050-6120/3/2/024001 - DOI - PubMed
    1. Andrade D.M., Clausen M.P., Keller J., Mueller V., Wu C., Bear J.E., Hell S.W., Lagerholm B.C., and Eggeling C.. 2015. Cortical actin networks induce spatio-temporal confinement of phospholipids in the plasma membrane: a minimally invasive investigation by STED-FCS. Sci. Rep. 5:11454 10.1038/srep11454 - DOI - PMC - PubMed
    1. Bas Orth C., Schultz C., Müller C.M., Frotscher M., and Deller T.. 2007. Loss of the cisternal organelle in the axon initial segment of cortical neurons in synaptopodin-deficient mice. J. Comp. Neurol. 504:441–449. 10.1002/cne.21445 - DOI - PubMed
    1. Boiko T., Vakulenko M., Ewers H., Yap C.C., Norden C., and Winckler B.. 2007. Ankyrin-dependent and -independent mechanisms orchestrate axonal compartmentalization of L1 family members neurofascin and L1/neuron-glia cell adhesion molecule. J. Neurosci. 27:590–603. 10.1523/JNEUROSCI.4302-06.2007 - DOI - PMC - PubMed
    1. Brachet A., Leterrier C., Irondelle M., Fache M.-P., Racine V., Sibarita J.-B., Choquet D., and Dargent B.. 2010. Ankyrin G restricts ion channel diffusion at the axonal initial segment before the establishment of the diffusion barrier. J. Cell Biol. 191:383–395. 10.1083/jcb.201003042 - DOI - PMC - PubMed

Associated data

LinkOut - more resources