. 2016 Nov 1;113(44):E6806-E6812.
doi: 10.1073/pnas.1607152113. Epub 2016 Oct 3.

Activation of SAT1 engages polyamine metabolism with p53-mediated ferroptotic responses

Affiliations

Activation of SAT1 engages polyamine metabolism with p53-mediated ferroptotic responses

Yang Ou et al. Proc Natl Acad Sci U S A. .

Abstract

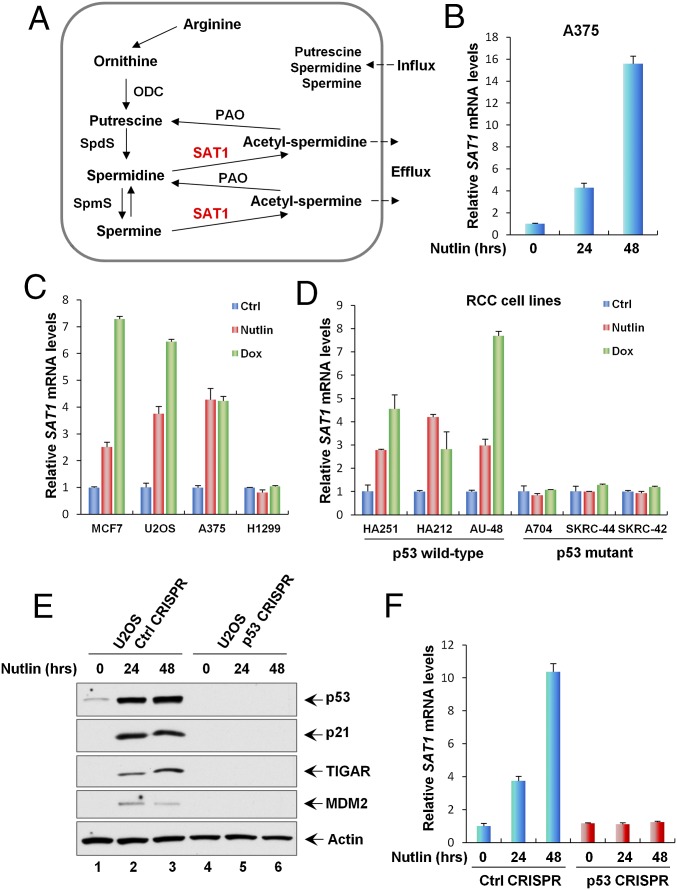
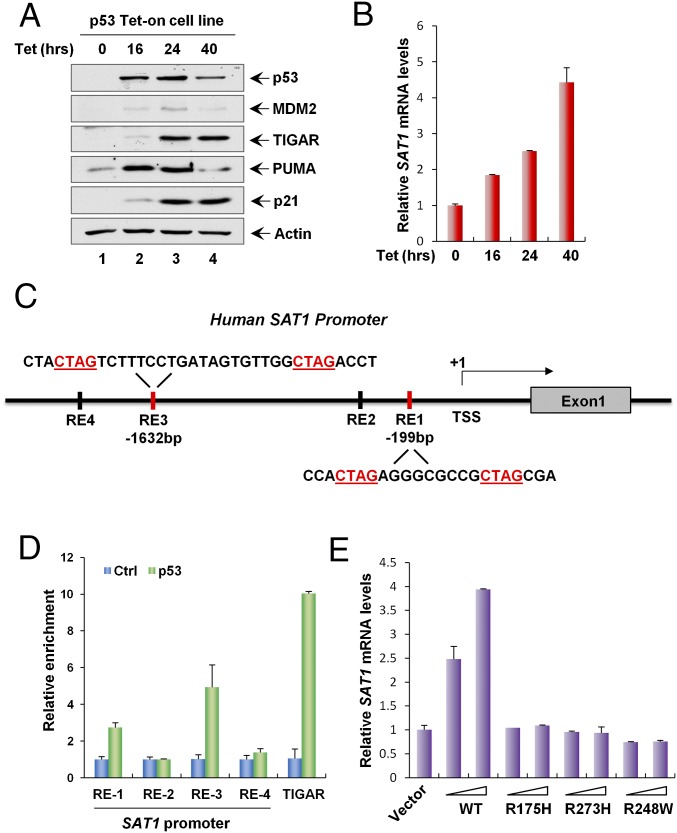
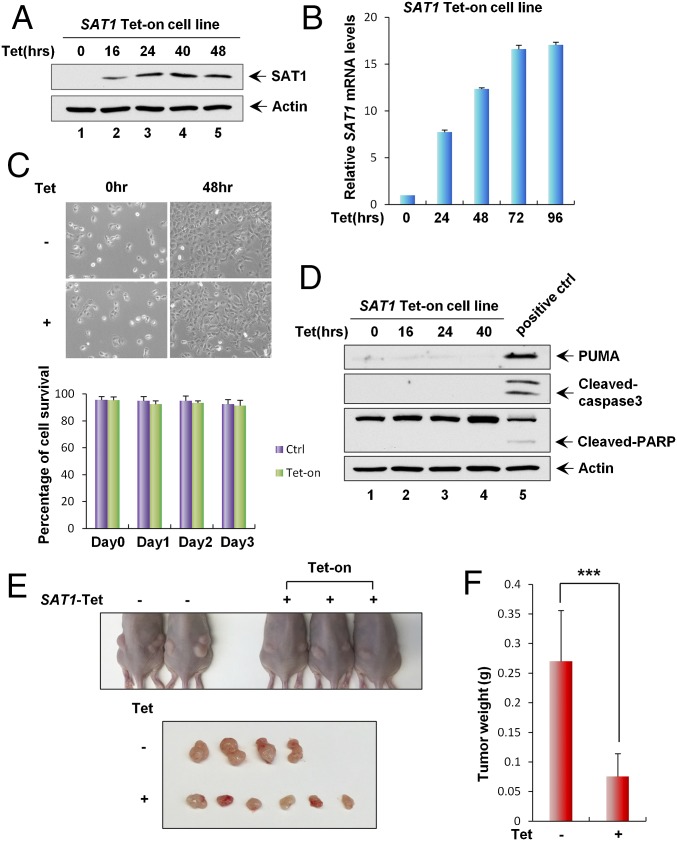
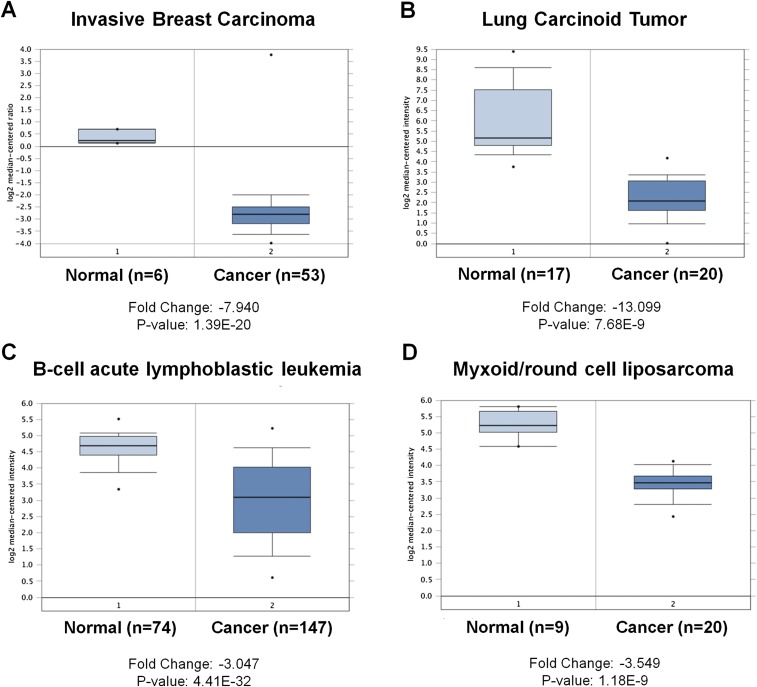
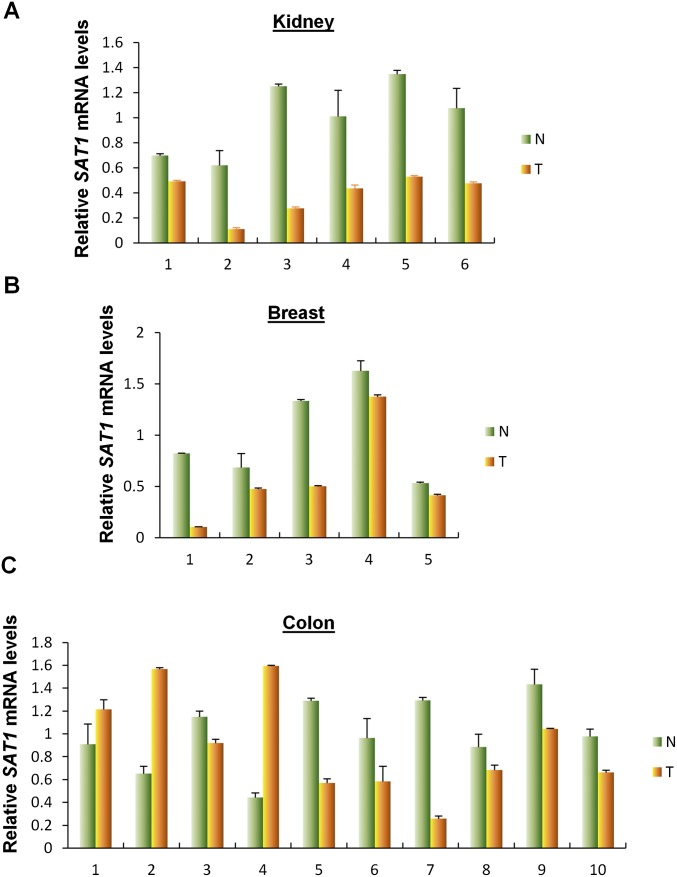
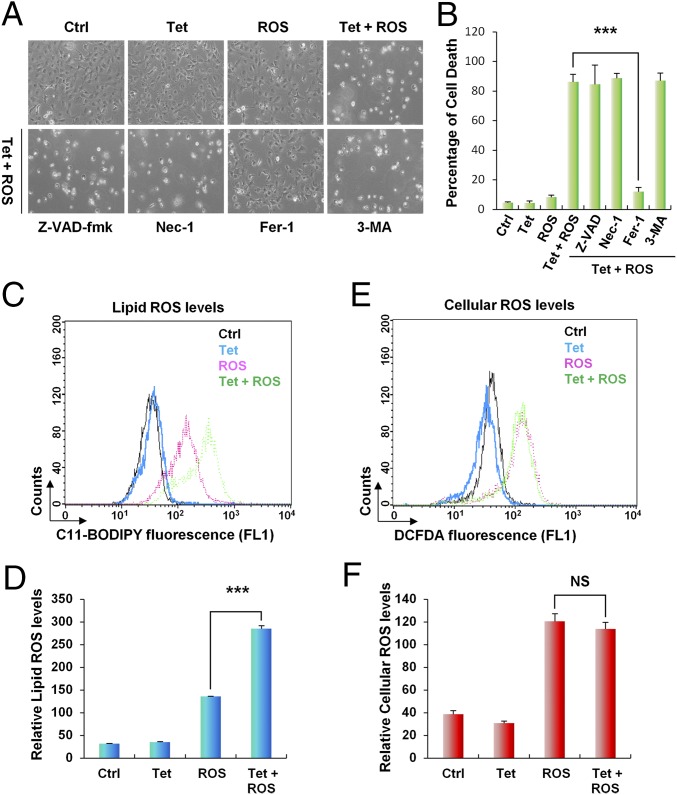
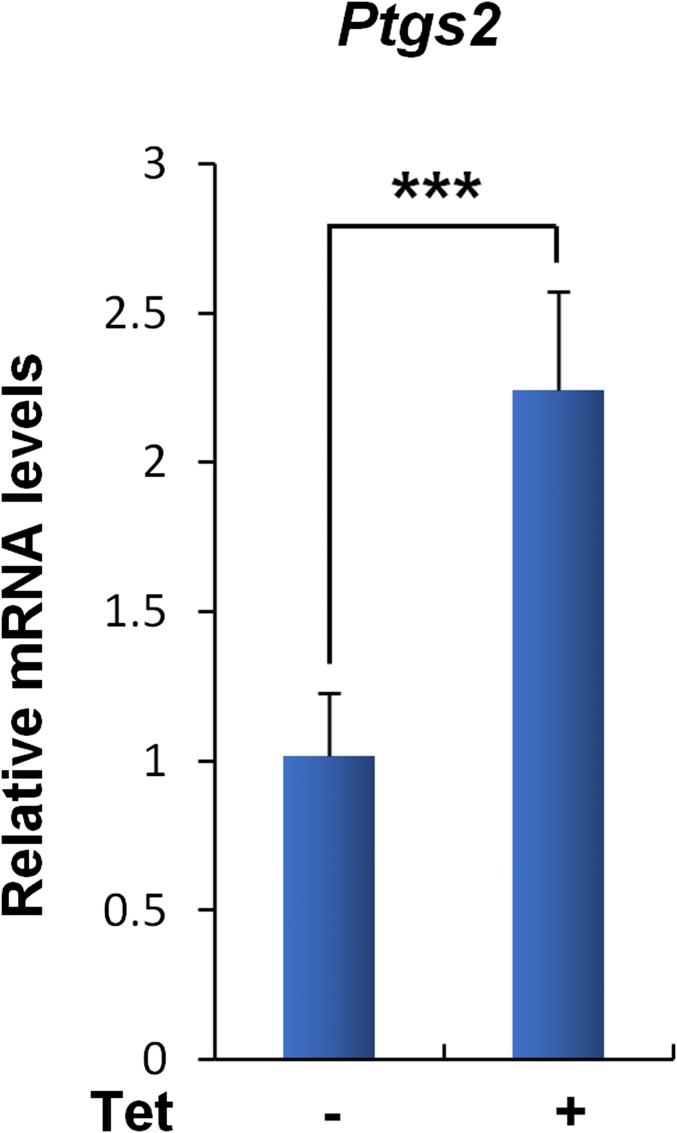
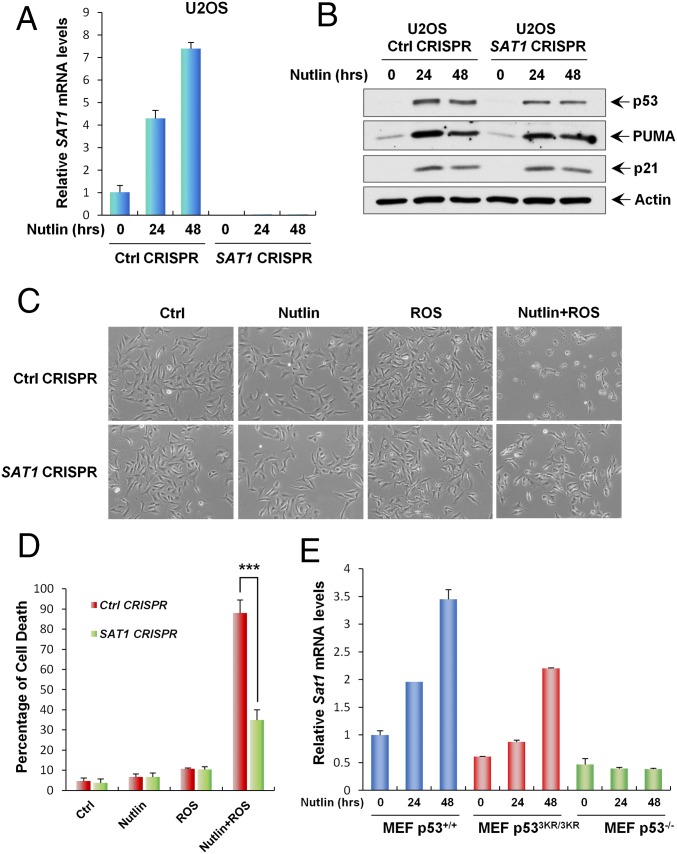
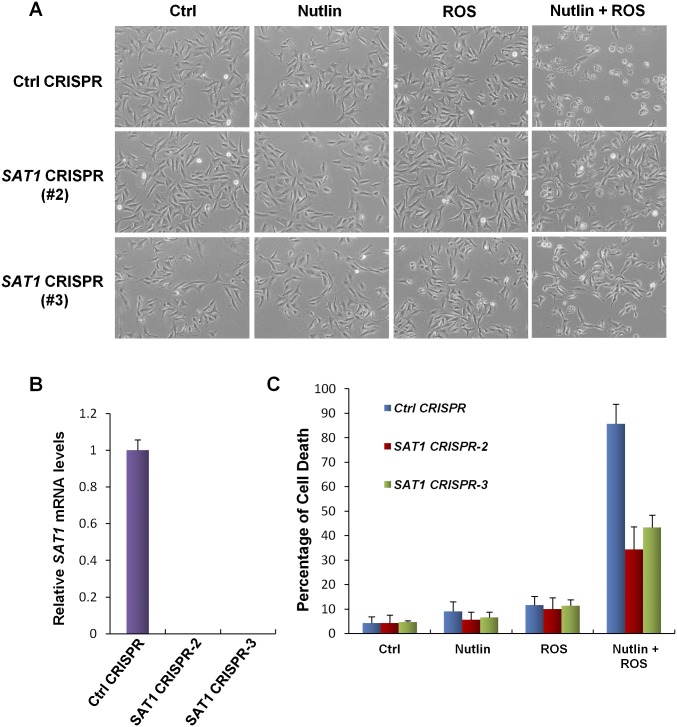
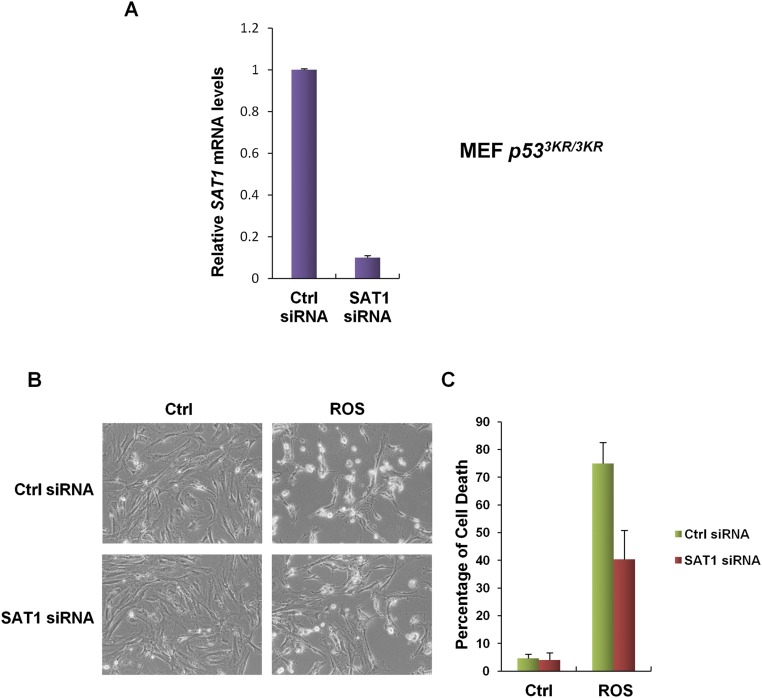
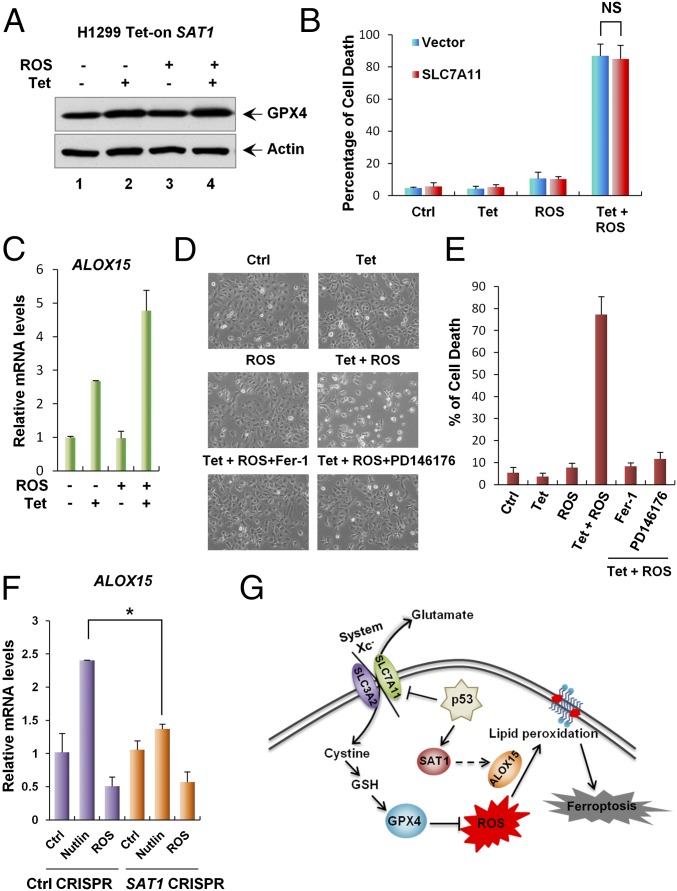
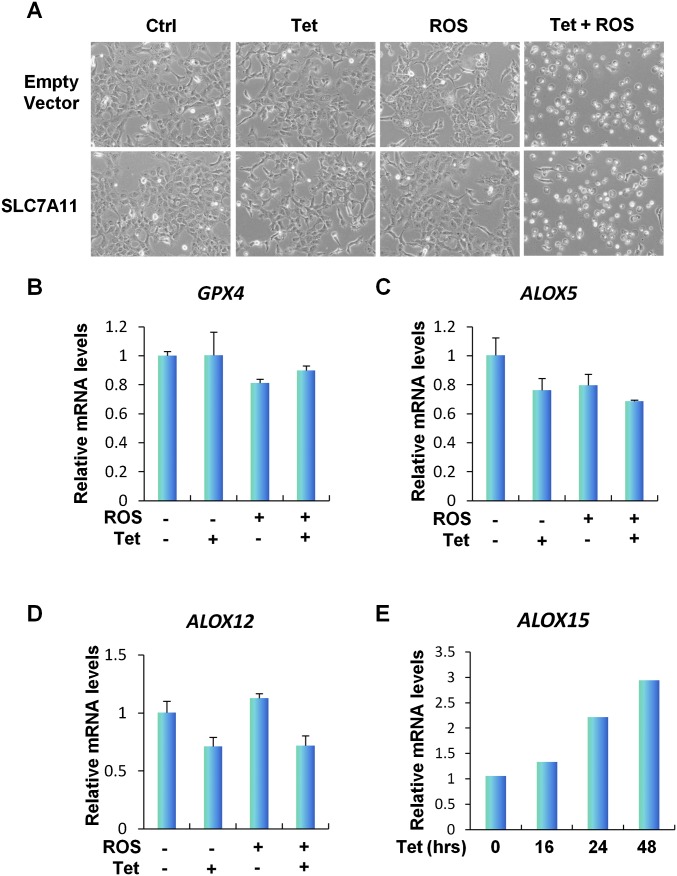
Although p53-mediated cell-cycle arrest, senescence, and apoptosis remain critical barriers to cancer development, the emerging role of p53 in cell metabolism, oxidative responses, and ferroptotic cell death has been a topic of great interest. Nevertheless, it is unclear how p53 orchestrates its activities in multiple metabolic pathways into tumor suppressive effects. Here, we identified the SAT1 (spermidine/spermine N1-acetyltransferase 1) gene as a transcription target of p53. SAT1 is a rate-limiting enzyme in polyamine catabolism critically involved in the conversion of spermidine and spermine back to putrescine. Surprisingly, we found that activation of SAT1 expression induces lipid peroxidation and sensitizes cells to undergo ferroptosis upon reactive oxygen species (ROS)-induced stress, which also leads to suppression of tumor growth in xenograft tumor models. Notably, SAT1 expression is down-regulated in human tumors, and CRISPR-cas9-mediated knockout of SAT1 expression partially abrogates p53-mediated ferroptosis. Moreover, SAT1 induction is correlated with the expression levels of arachidonate 15-lipoxygenase (ALOX15), and SAT1-induced ferroptosis is significantly abrogated in the presence of PD146176, a specific inhibitor of ALOX15. Thus, our findings uncover a metabolic target of p53 involved in ferroptotic cell death and provide insight into the regulation of polyamine metabolism and ferroptosis-mediated tumor suppression.

Keywords: SAT1; ferroptosis; p53; polyamine metabolism; tumor suppression.


Conflict of interest statement

The authors declare no conflict of interest.

Figures

Fig. 1.
Fig. 1.
SAT1 is induced by p53. (A) The polyamine metabolism pathway. ODC, ornithine decarboxylase; PAO, N1-acetylpolyamine oxidase; SAT1, spermine/spermidine N1-acetyltransferase 1; SpdS, spermidine synthase; SpmS, spermine synthase. (B) qRT-PCR analysis of the SAT1 transcript level was performed with total RNAs purified from A375 cells treated with Nutlin (10 μM) for the indicated times. (C) qRT-PCR analysis of the mRNA expression levels of SAT1 in the indicated cancer cell lines (MCF7, U2OS, A375, and H1299) untreated (Ctrl) or treated with Nutlin (10 μM) or Dox (0.2 μg/mL) for 24 h. (D) The indicated RCC cell lines were untreated or treated with Nutlin (10 μM) or Dox (0.2 μg/mL) for 24 h, and SAT1 mRNA levels were measured using qRT-PCR. (E) U2OS control CRISPR and p53 CRISPR cell lines were treated with Nutlin (10 μM) for the indicated times, and total protein lysates were subjected to Western blotting analysis for the expression of p53, p21, TIGAR, MDM2, and Actin. (F) SAT1 transcript levels were measured by qRT-PCR in U2OS control CRISPR and p53 CRISPR cell lines treated with Nutlin (10 μM) for the indicated times. All mRNA expression levels were normalized with GAPDH. Error bars represent the SD from three experiments.
Fig. 2.
Fig. 2.
SAT1 is a transcriptional target of p53. (A) p53 Tet-on H1299 cells were induced with 0.5 μg/mL tetracycline (Tet) for the indicated times, and total protein lysates were analyzed by Western blotting using antibodies against p53, MDM2, TIGAR, PUMA, p21, and Actin. (B) SAT1 mRNA expression levels were measured by qRT-PCR in p53 Tet-on H1299 cells induced with 0.5 μg/mL tetracycline for the indicated times. (C) Schematic representation of the promoter region in the human SAT1 gene. The p53-binding sites upstream of the first exon are indicated as responsive elements (RE). TSS, transcription start site. (D) ChIP-qPCR was performed in H1299 cells transfected with empty vector (Ctrl) or p53. (E) H1299 cells were transfected with empty vector or increasing amounts of p53 wild-type or mutant vectors (R175H, R273H, and R248W), and SAT1 mRNA levels were analyzed by qRT-PCR.
Fig. 3.
Fig. 3.
Effect of SAT1 overexpression on growth arrest, apoptosis, and tumorigenesis. (A) Cells in the SAT1 Tet-on inducible stable cell line were treated with 0.5 μg/mL tetracycline for the indicated times followed by Western blot analysis. Actin was used as a loading control. (B) qRT-PCR analysis of mRNA levels of SAT1 in cells in the SAT1 Tet-on stable cell line at the indicated times after induction. (C) Representative phase-contrast images of SAT1 Tet-on stable cells uninduced (−) or induced with 0.5 μg/mL tetracycline (+) for 48 h. (Magnification: 10×.) The percentage of cells surviving at the indicated times is shown as mean ± SD. (D) SAT1 Tet-on stable cells were induced with 0.5 μg/mL tetracycline for the indicated times, and total protein lysates were subjected to Western blot analysis for the expression of PUMA, cleaved caspase3, cleaved PARP, and Actin. (E) Xenograft tumors from SAT1 Tet-on cells shown in A. (F) Tumor weight was determined (error bars indicate SD from four tumors in control mice and six tumors in Tet-on mice). ***P < 0.001.
Fig. S1.
Fig. S1.
SAT1 is down-regulated in tumors of human cancer patients. (AD) Datasets obtained from the Oncomine database showing that the transcription levels of SAT1 in the indicated cancer types are lower in tumors (cancer) than in adjacent normal tissues (normal). The actual fold change and P value are indicated at the bottom of each panel.
Fig. S2.
Fig. S2.
SAT1 is down-regulated in tumors of human cancer patients (continued). (AC) Quantitative RT-PCR analysis of the expression levels of SAT1 in paired normal and cancer tissues from kidney (A), breast (B), and colon (C). Average expression levels in normal tissues were normalized to 1 in each type of cancer. Data are shown as the mean ± SD from two technical replicates. N, normal tissue; T, cancer tissue.
Fig. 4.
Fig. 4.
SAT1 overexpression leads to lipid peroxidation and ferroptosis upon ROS stress. (A) Representative phase-contrast images of SAT1 Tet-on cells treated with 0.5 μg/mL tetracycline and 60 μM TBH for 24 h. The images also show cells treated with tetracycline and TBH with the addition of specific cell-death inhibitors for 24 h: Z-VAD-fmk, a caspase inhibitor, 10 μg/mL; Necrostatin 1 (Nec-1), a necroptosis inhibitor, 10 μg/mL; Ferrostatin-1 (Fer-1), a ferroptosis inhibitor, 2 μM; and 3-methyladenine (3-MA), an autophagy inhibitor, 2 mM. (B) The percentages of cell death for all experiments shown in A were measured by trypan blue exclusion assay. (C and E) Lipid (C) and cytosolic (E) ROS production in SAT1 Tet-on cells treated with tetracycline and TBH for 24 h was assessed by flow cytometry using C11-BODIPY and H2DCFDA. (D and F) Quantification of lipid (D) and cytosolic (F) ROS levels from three representative experiments. Data are shown as mean ± SD. ***P < 0.001. NS, no significant difference.
Fig. S3.
Fig. S3.
The ferroptosis marker Ptgs2 is up-regulated in xenograft tumors with SAT1 induction. The mRNA levels of Ptgs2 were determined by qRT-PCR analysis in four xenograft tumors without SAT1 induction (−) and in six xenograft tumors with SAT1 induction (+). Data are shown as mean ± SD. ***P < 0.001.
Fig. 5.
Fig. 5.
SAT1 contributes to p53-mediated ferroptosis upon ROS stress. (A) qRT-PCR analysis of SAT1 mRNA levels in stable U2OS control (Ctrl) CRISPR and SAT1 CRISPR cell lines treated with 10 μM Nutlin for the indicated times. (B) U2OS control CRISPR and SAT1 CRISPR stable cell lines were treated with 10 μM Nutlin for the indicated times, and total protein lysates were subjected to Western blot analysis for the expression of p53, PUMA, p21, and Actin. (C) Images of U2OS control CRISPR and SAT1 CRISPR cells treated with 10 μM Nutlin and 350 μM TBH for 24 h. (D) Quantification of cell death in C from three technical triplicates. Data are shown as mean ± SD. ***P < 0.001. (E) MEFs from the indicated genotypes were treated with 10 μM Nutlin, and Sat1 transcript levels were measured by qRT-PCR.
Fig. S4.
Fig. S4.
SAT1 contributes to p53-mediated ferroptosis upon ROS stress (continued). (A) Representative phase-contrast images showing the U2OS control CRISPR cell line and two additional stable SAT1 CRISPR clones treated with 10 μM Nutlin and 350 μM TBH for 24 h. (B) qRT-PCR analysis of mRNA levels of SAT1 in the control CRISPR cell line and SAT1 CRISPR clones. (C) Quantification of cell death in A from three technical triplicates (mean ± SD).
Fig. S5.
Fig. S5.
SAT1 contributes to p53-3KR–mediated ferroptosis upon oxidative stress. (A) qRT-PCR analysis of SAT1 mRNA levels in p533KR/3KR MEFs transfected with control siRNA or SAT1 siRNA for 48 h. (B) p533KR/3KR MEFs were transfected with control siRNA or SAT1 siRNA for 48 h and then were treated with TBH (150 μM) for 24 h before the images were taken. (C) Quantification of cell death in B from three technical triplicates (mean ± SD).
Fig. 6.
Fig. 6.
Mechanism of SAT1-induced ferroptosis. (A) SAT1 Tet-on cells were treated with tetracycline and TBH, and total cell lysates were subjected to Western blot analysis for the expression of GPX4. Actin was used as a loading control. (B) SAT1 Tet-on cells were transfected with either control or plasmid overexpressing SLC7A11 followed by treatment with tetracycline and TBH for 24 h. Quantification of cell death is shown as the mean ± SD from three technical triplicates. NS, no significant difference. (C) qRT-PCR analysis of ALOX15 mRNA levels in SAT1 Tet-on cells treated with tetracycline and TBH. (D) Representative phase-contrast images of SAT1 Tet-on cells treated with tetracycline and TBH with the addition of the ferroptosis inhibitor (Fer-1) or ALOX15 inhibitor (PD146176). (E) The percentages of cell death for all experiments shown in D were measured by trypan blue exclusion assay. (F) U2OS control CRISPR and SAT1 CRISPR cells were treated with 10 μM Nutlin or 350 μM TBH for 24 h, and total RNA was extracted for the analysis of ALOX15 mRNA levels using qRT-PCR. Data are shown as the mean ± SD of three technical triplicates. *P < 0.05. (G) A model for the regulation of ferroptosis by p53, SAT1, and SLC7A11.
Fig. S6.
Fig. S6.
Mechanism of SAT1-induced ferroptosis (continued). (A) Representative phase-contrast images of SAT1 Tet-on cells transfected with empty vector or vector overexpressing SLC7A11 followed by treatment with tetracycline and TBH (60 μM) for 24 h. (BD) qRT-PCR analysis of GPX4 (B), ALOX5 (C), and ALOX12 (D) mRNA levels in SAT1 Tet-on cells treated with tetracycline and TBH. (E) SAT1 Tet-on cells were induced with 0.5 μg/mL tetracycline for the indicated times, and ALOX15 mRNA levels were examined using qRT-PCR.

Comment in

  • Ironing out how p53 regulates ferroptosis.
    Murphy ME. Murphy ME. Proc Natl Acad Sci U S A. 2016 Nov 1;113(44):12350-12352. doi: 10.1073/pnas.1615159113. Epub 2016 Oct 17. Proc Natl Acad Sci U S A. 2016. PMID: 27791175 Free PMC article. No abstract available.

Similar articles

Cited by

References

    1. Vousden KH, Prives C. Blinded by the light: The growing complexity of p53. Cell. 2009;137(3):413–431. - PubMed
    1. Levine AJ, Oren M. The first 30 years of p53: Growing ever more complex. Nat Rev Cancer. 2009;9(10):749–758. - PMC - PubMed
    1. Vogelstein B, Lane D, Levine AJ. Surfing the p53 network. Nature. 2000;408(6810):307–310. - PubMed
    1. Lane DP. Cancer. p53, guardian of the genome. Nature. 1992;358(6381):15–16. - PubMed
    1. Donehower LA, et al. Mice deficient for p53 are developmentally normal but susceptible to spontaneous tumours. Nature. 1992;356(6366):215–221. - PubMed

Publication types

MeSH terms