. 2016 Oct 4:6:34635.
doi: 10.1038/srep34635.

Survival Motor Neuron (SMN) protein is required for normal mouse liver development

Affiliations

Survival Motor Neuron (SMN) protein is required for normal mouse liver development

Eva Szunyogova et al. Sci Rep. .

Erratum in

Abstract

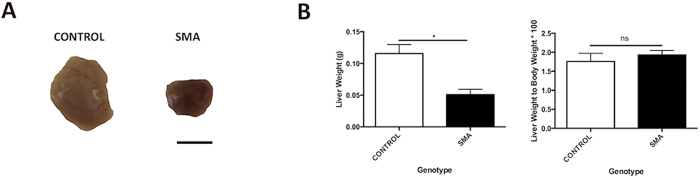
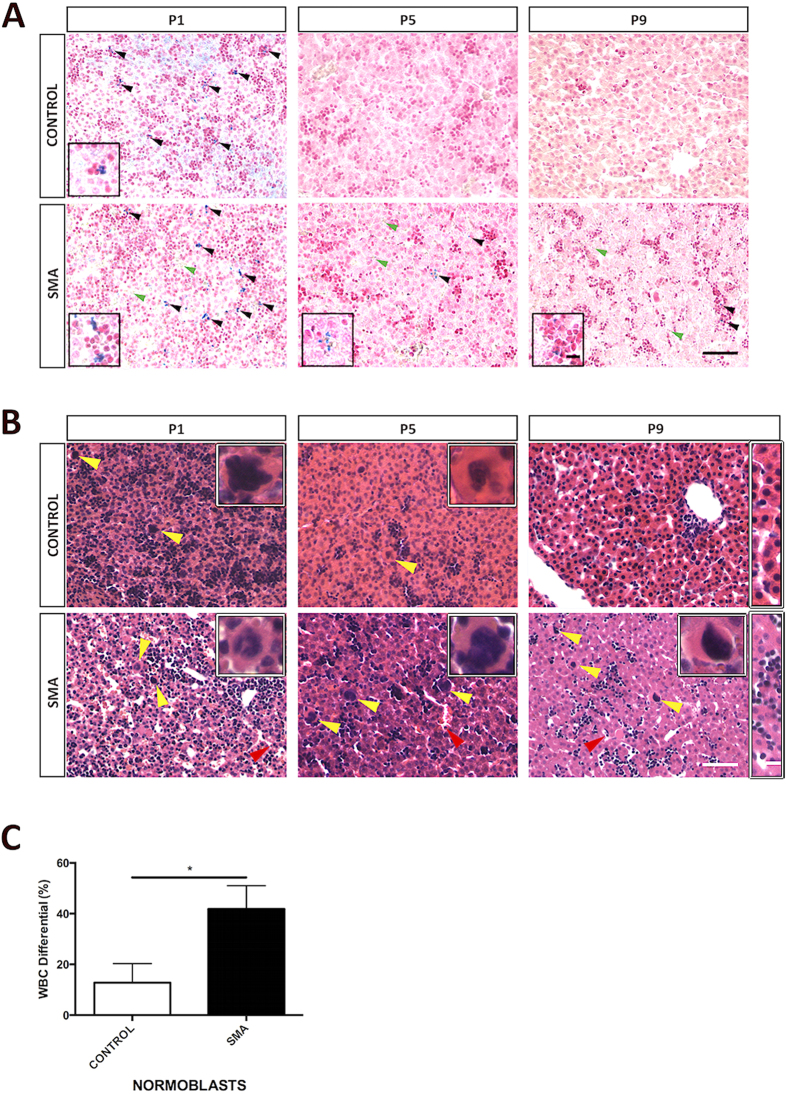
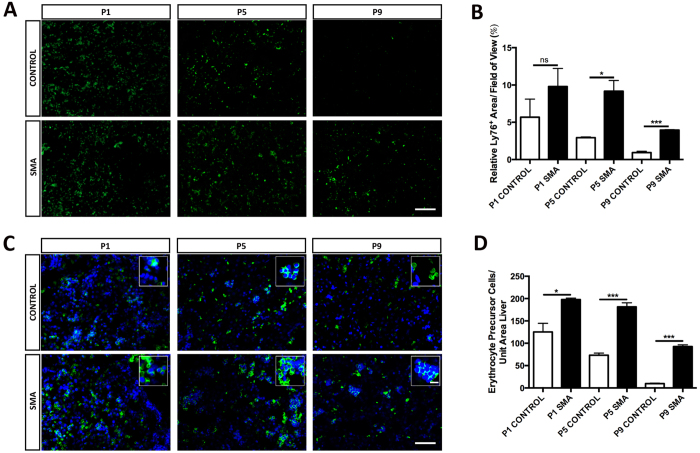
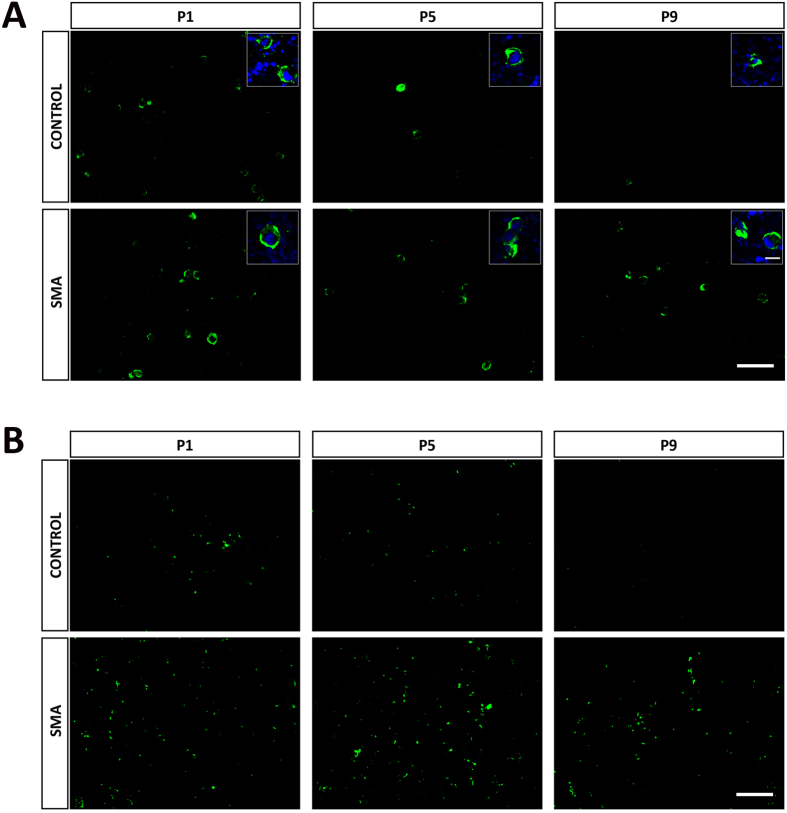
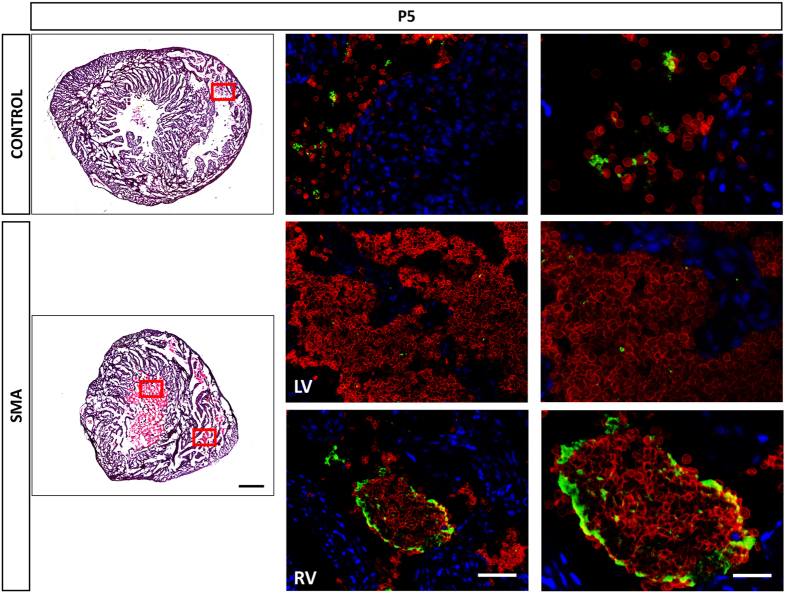
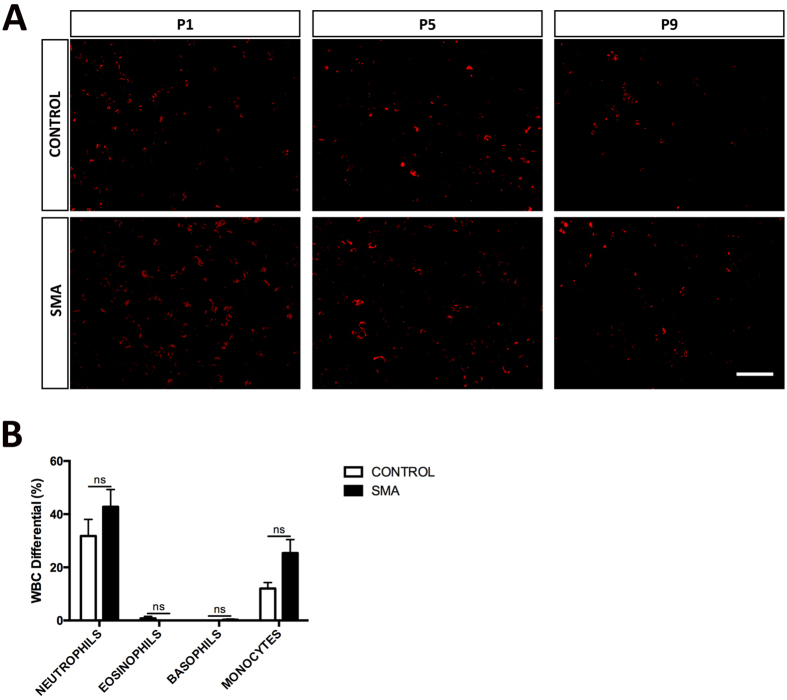
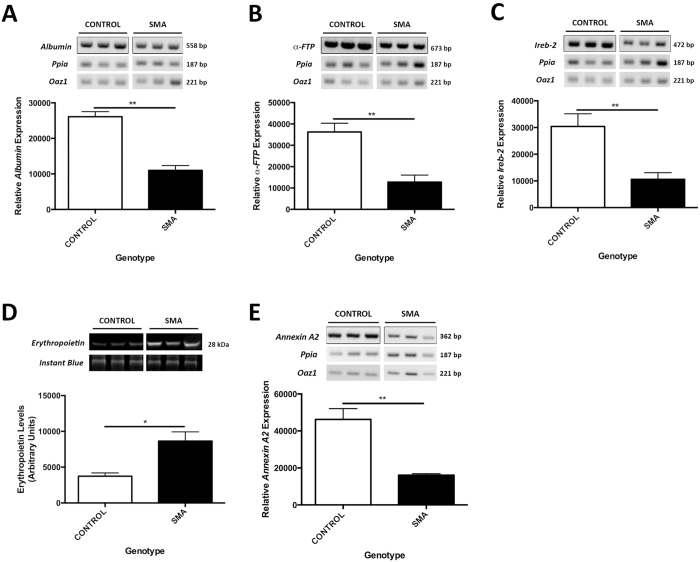
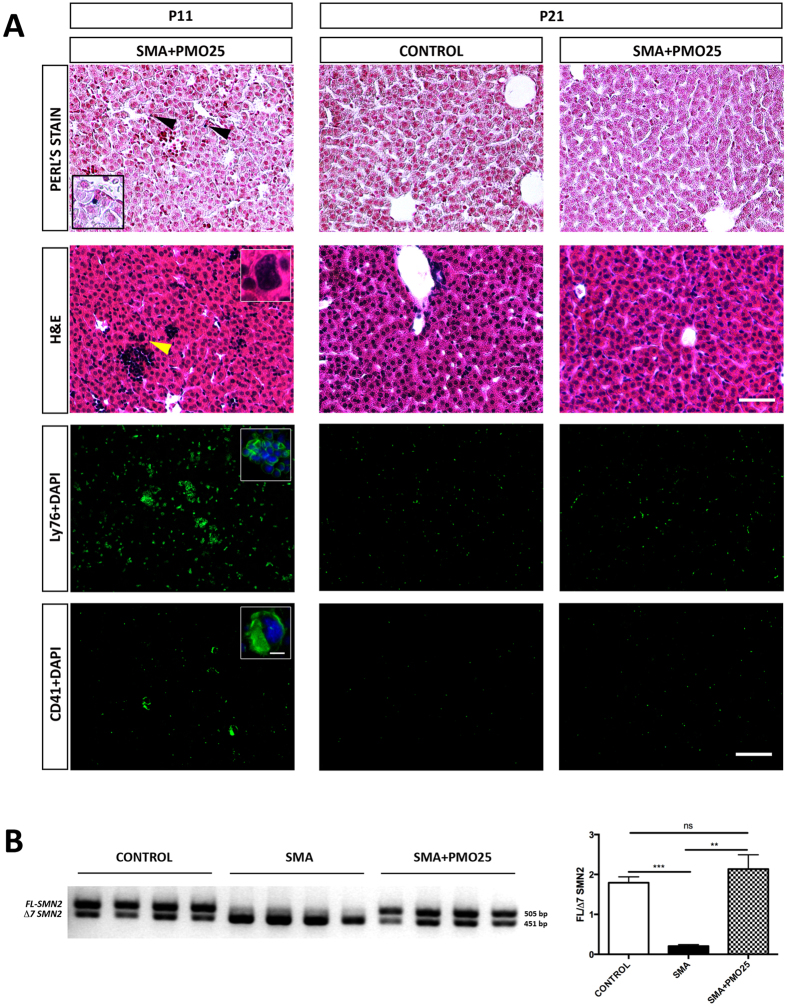
Spinal Muscular Atrophy (SMA) is caused by mutation or deletion of the survival motor neuron 1 (SMN1) gene. Decreased levels of, cell-ubiquitous, SMN protein is associated with a range of systemic pathologies reported in severe patients. Despite high levels of SMN protein in normal liver, there is no comprehensive study of liver pathology in SMA. We describe failed liver development in response to reduced SMN levels, in a mouse model of severe SMA. The SMA liver is dark red, small and has: iron deposition; immature sinusoids congested with blood; persistent erythropoietic elements and increased immature red blood cells; increased and persistent megakaryocytes which release high levels of platelets found as clot-like accumulations in the heart. Myelopoiesis in contrast, was unaffected. Further analysis revealed significant molecular changes in SMA liver, consistent with the morphological findings. Antisense treatment from birth with PMO25, increased lifespan and ameliorated all morphological defects in liver by postnatal day 21. Defects in the liver are evident at birth, prior to motor system pathology, and impair essential liver function in SMA. Liver is a key recipient of SMA therapies, and systemically delivered antisense treatment, completely rescued liver pathology. Liver therefore, represents an important therapeutic target in SMA.


Conflict of interest statement

FM is a principal investigator on Ionis funded clinical trial on AON in SMA; and in two Roche funded trials on SMA. Since 2014 he is member of the Pfizer Rare Disease Scientific Advisory Board. The remaining authors declare no competing financial interests.

Figures

Figure 1
Figure 1. SMA Liver is Relatively Normal in Size with a Distinctive Dark Red Phenotype.
(A) Gross anatomy of SMA liver harvested from late symptomatic Taiwanese mice. Scale bar, 50 mm. (B) Quantification of liver weight of P9 Taiwanese mice. p values were calculated using two-tailed Student’s t-test. Error bars, mean ± s.e.m. (n = 3 mice per group).
Figure 2
Figure 2. Persistent Erythropoietic Elements in SMA Liver Shows Developmental Failure.
(A) Representative light microscopy of Perl’s staining of livers at birth (P1) and postnatal days 5 (P5) and 9 (P9). Note the presence of iron deposits (black arrowheads) in later stages of development in SMA liver. P9 SMA liver appears to lack the organised hepatic plate structure as seen in control with predominant erythroblastic islands (dark red nuclei clusters). Green arrowheads point to RBCs outside main vessels. Magnified panels at bottom left show iron deposits (blue). Scale bar, 50 μm. Magnified panel scale bar, 10 μm. (B) Representative light microscopy of H&E-stained micrographs of livers. Red arrowheads show nucleated RBC within sinusoid. Yellow arrowheads and magnified panels at top right show megakaryocytes. P9 rectangular magnified panel shows nicely formed hepatic plate in control and lack thereof in SMA. Scale bar, 50 μm. Magnified panel scale bar, 10 μm. (C) White blood cell (WBC) differential showing the percentage of normoblasts in control and SMA blood samples obtained from P8 Taiwanese mice. p values were calculated using two-tailed Student’s t-test. Error bars, mean ± s.e.m. (n = 4 mice per group).
Figure 3
Figure 3. Prolonged Active Erythropoiesis in SMA Liver.
(A) Representative micrographs labelled with the Ly76 marker (green), in sections of liver obtained from Taiwanese mice. Scale bar, 100 μm. (B) Quantification of erythrocytes and their precursors expressed as a percentage of cross-sectional liver area. p values were calculated using two-tailed Student’s t-test. Error bars, mean ± s.e.m. (n ≥ 3 mice per group). (C) Representative micrographs and their magnified panels co-stained with the Ly76 marker (green) and DAPI (blue), in sections of liver obtained from Taiwanese mice. Scale bar, 50 μm. Magnified panel scale bar, 10 μm. (D) Quantification of erythrocyte precursor cells expressed as a percentage of cross-sectional liver area. p values were calculated using two-tailed Student’s t-test. Error bars, mean ± s.e.m. (n ≥ 3 mice per group).
Figure 4
Figure 4. Megakaryocytes Persist and Produce Abnormally High Levels of Platelets in SMA Liver.
(A) Representative micrographs of CD41 (green) staining for erythroid lineage and their magnified panels co-stained with DAPI (blue), showing megakaryocytes in sections of liver from Taiwanese mice. Scale bar, 100 μm. Magnified panel scale bar, 10 μm. (B) Representative micrographs of CD41 (green) staining showing platelets in sections of liver from Taiwanese mice. Scale bar, 50 μm.
Figure 5
Figure 5. Platelets Aggregate into Circulating Clot-like Accumulations in SMA.
Representative micrographs of H&E and RBCs (Ly76+ DAPI stain - red) and platelets (CD41+ stain - green) co-stained with DAPI (blue) of heart sections obtained at P5 from Taiwanese mice. Red squares show where Immunofluorescence images were taken. LV = Left Ventricle. RV = Right Ventricle. Note that the blood accumulation observed in SMA LV is not clotted unlike the one in RV. Scale bar for H&E, 500 μm. Scale bar for Immunofluorescence - left, 50 μm and - right, 10 μm.
Figure 6
Figure 6. Myelopoiesis Does Not Appear to Be Affected in SMA Liver.
(A) Representative micrographs labelled with the CD11b to show myeloid leukocytes (red), in sections of liver obtained from Taiwanese mice. Scale bar, 50 μm. (B) WBC differential showing the percentage of granulocytes and monocytes in control and SMA blood samples obtained from P8 Taiwanese mice. p values were calculated using two-tailed Student’s t-test. Error bars, mean ± s.e.m. (n = 4 mice per group).
Figure 7
Figure 7. Molecular Pathways are Modified in SMA Liver.
Semi-quantitative RT-PCR analysis of albumin (A), α-FTP (B), Ireb-2 (C) and Annexin A2 (E) transcripts in control and SMA livers normalised to Ppia and Oaz1. (D) Total erythropoietin protein levels analysed by Western Blot and normalised to the total protein (Instant Blue). p values were calculated using two-tailed Student’s t-test. Error bars, mean ± s.e.m. (n ≥ 3 mice per group). For uncropped gels/blot see Supplementary Figure 1.
Figure 8
Figure 8. Antisense Treatment Prolonged Life and Normalised Liver Development in SMA.
(A) Representative micrographs of Perl’s, H&E, Ly76, and CD41 staining of liver obtained from treated and non-treated mice at two different time-points, P11 and P21. Note the persisting presence of iron deposits (black arrowheads, magnified panel), predominant erythroblastic islands, and megakaryocytes in SMA treated liver at P11. This pathology appears to be completely ameliorated at P21. Scale bar: Perl’s and H&E staining, 50 μm; Ly76 and CD41 staining, 100 μm; Magnified panel, 10 μm. (B) Semi-quantitative RT-PCR analysis of the ratio of FL-SMN2 to Δ7 SMN2 transcripts between Control, SMA and antisense treated SMA liver at P11. p values were calculated using two-tailed Student’s t-test. Error bars, mean ± s.e.m. (n = 4 mice per group). For uncropped gel see Supplementary Figure 2.

Similar articles

Cited by

References

    1. Werdnig G. Two early infantile hereditary cases of progressive muscular atrophy simulating dystrophy, but on a neural basis. Arch. Psychiat. Nurs. 22, 437–481 (1891). - PubMed
    1. Hoffmann J. Familial spinal muscular atrophy in infancy. Dtsch. Z. Nervenheilkd. 3, 427–470 (1892).
    1. Lefebvre S. et al.. Identification and characterization of a spinal muscular atrophy-determining gene. Cell. 80, 155–165 (1995). - PubMed
    1. Burghes A. H. M. & Beattie C. E. Spinal muscular atrophy: why do low levels of survival motor neuron protein make motor neurons sick? Nat. Rev. Neurosci. 10, 597–609 (2009). - PMC - PubMed
    1. Hamilton G. & Gillingwater T. H. Spinal muscular atrophy: going beyond the motor neuron. Trends. Mol. Med. 19, 40–50 (2013). - PubMed

Publication types

MeSH terms

Substances

LinkOut - more resources