. 2016 Oct 4:6:34479.
doi: 10.1038/srep34479.

Hierarchical phosphorylation of apical membrane antigen 1 is required for efficient red blood cell invasion by malaria parasites

Affiliations

Hierarchical phosphorylation of apical membrane antigen 1 is required for efficient red blood cell invasion by malaria parasites

Boris Prinz et al. Sci Rep. .

Abstract

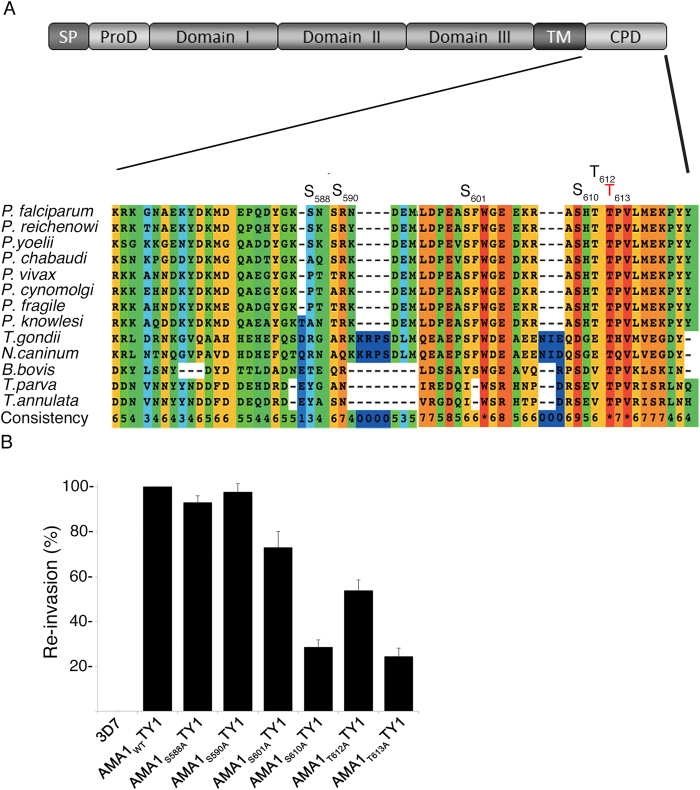
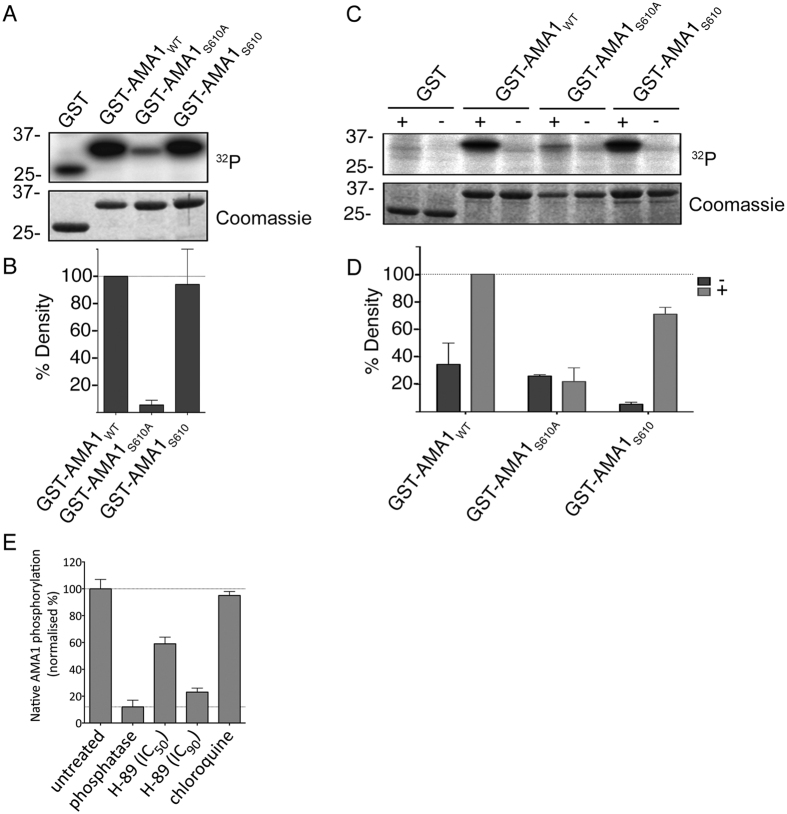
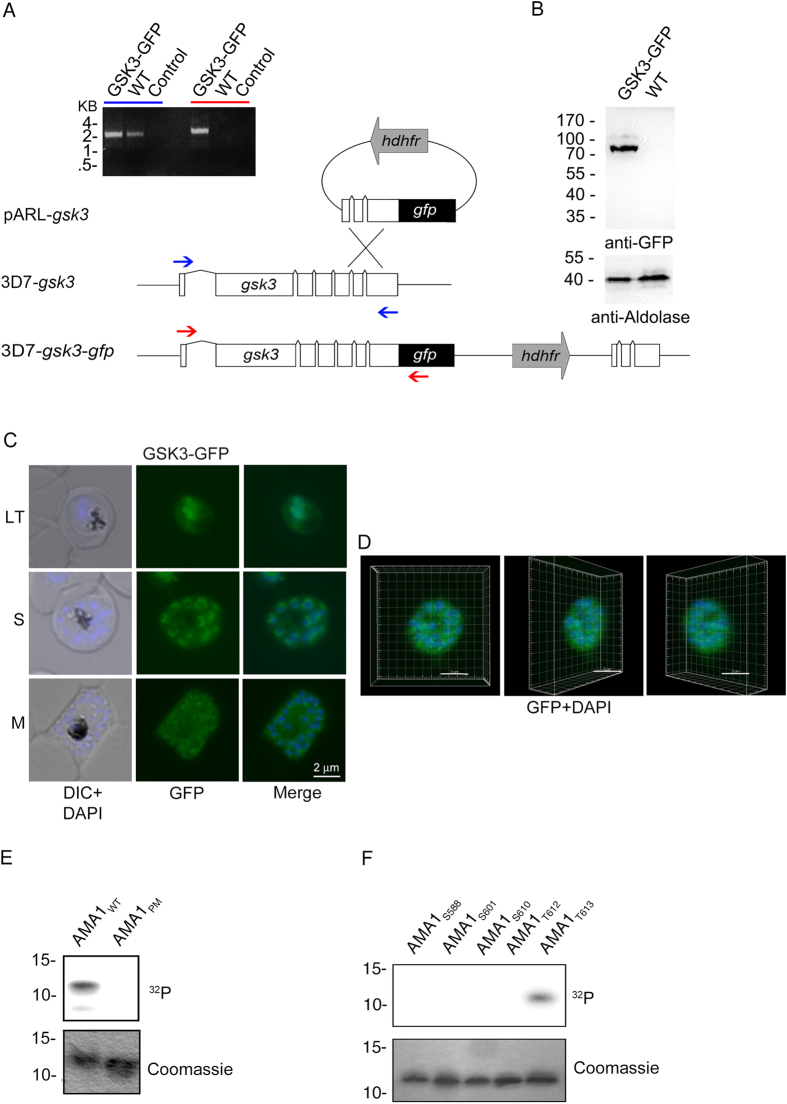
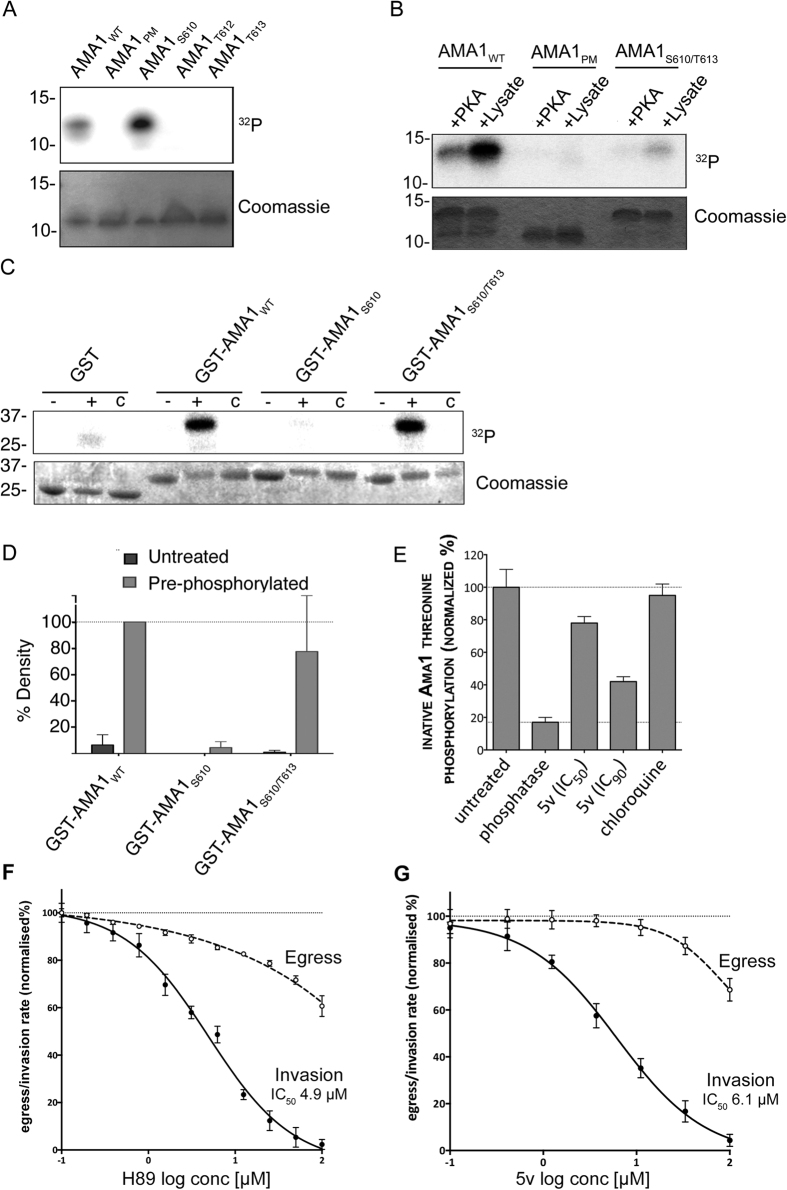
Central to the pathogenesis of malaria is the proliferation of Plasmodium falciparum parasites within human erythrocytes. Parasites invade erythrocytes via a coordinated sequence of receptor-ligand interactions between the parasite and host cell. One key ligand, Apical Membrane Antigen 1 (AMA1), is a leading blood-stage vaccine and previous work indicates that phosphorylation of its cytoplasmic domain (CPD) is important to its function during invasion. Here we investigate the significance of each of the six available phospho-sites in the CPD. We confirm that the cyclic AMP/protein kinase A (PKA) signalling pathway elicits a phospho-priming step upon serine 610 (S610), which enables subsequent phosphorylation in vitro of a conserved, downstream threonine residue (T613) by glycogen synthase kinase 3 (GSK3). Both phosphorylation steps are required for AMA1 to function efficiently during invasion. This provides the first evidence that the functions of key invasion ligands of the malaria parasite are regulated by sequential phosphorylation steps.


Figures

Figure 1
Figure 1. Functional analysis of AMA1 phosphorylation sites.
(A) Multiple alignment of the cytoplasmic domain of various AMA1 from Apicomplexa. The conservation is scored and colour coded by PRALINE (www.ibi.vu.nl). Amino acids predicted to be phosphorylated in P. falciparum by NetPhos (www.cbs.dtu.dk/services/NetPhos) and confirmed by mass spectrometry are highlighted. S610 was previously shown to be essential for efficient erythrocyte invasion. (B) The invasion ability of the different AMA1-TY1 parasite strains expressing AMA1 with single mutations in each phosphorylation site was investigated by an invasion assay. Assays were performed in the presence of 100 μg/mL R1 peptide. Re-invasion was normalised to 3D7 and AMA1WT-TY1, which were used as controls. Error bars correspond to standard errors. Assays were performed in triplicates in three independent experiments.
Figure 2
Figure 2. S610 is targeted by PfPKA.
(A) Autoradiograph and SDS-PAGE of recombinant AMA1-GST variants treated with bovine heart PKA in the presence of cAMP and 32P-γ-ATP. The AMA1 variants either had S610 mutated to alanine (AMA1S610A) or had all phospho-sites except for S610 (AMA1S610) mutated. Purified GST serves as negative and AMA1WT as positive control. (B) Signal intensities were quantified using Image Gauge software (Fujifilm, Image Gauge V4.0). Signal intensity of the GST sample was subtracted from each sample and they were then normalized against the signal intensity of the AMA1WT sample. Error bars correspond to standard deviation of two independent experiments done in triplicate. (C) SDS-PAGE and autoradiograph of in vitro phosphorylation of GST, AMA1WT, AMA1S610A and AMA1S610 after incubation with schizont material in the presence of 32P-γ-ATP and either with (+) or without (-) cAMP. (D) Densitometric quantification with error bars corresponds to standard deviation of two independent experiments done in triplicates. (E) Sandwich ELISA demonstrating H-89-induced inhibition of native AMA1 phosphorylation at S610. Parasites were treated with H-89 for 2 hours during egress and invasion and a mouse anti-PfAMA1 antibody was used to capture PfAMA1 from culture lysates. Phosphorylation of S610 was detected in an ELISA format using the anti-PfAMA1S610p antibody. Histograms were generated after normalizing against uninfected (0%, background) and untreated (100%) culture signals. Lambda phosphatase-treatment was used to denote zero phosphorylation and chloroquine treatment was used to exclude parasite growth arrest as a cause for reduced phosphorylation.
Figure 3
Figure 3. T613 is phosphorylated by GSK3.
(A–D) Expression and localization of PfGSK3 and its PKA dependent phosphorylation of AMA1. (A) Schematic drawing of the GSK3-GFP 3′replacement approach in 3D7 parasites and diagnostic PCR revealing plasmid integration. The gsk3 gene has a six exon structure and an open reading frame of 2472 base pairs. Approximately 1 kb of the 3′ end was fused with the coding sequence of GFP (black) and cloned into a pARL derivate (pARL-gsk3-3’repl-gfp). The human dihydrofolate reductase (hDHFR, grey box) of the plasmid allowed selection of transgenic parasites. Position of oligonucleotides used for diagnostic PCR are shown with blue and red arrows. Sizes are indicated in kilo bases (kb). (B) Expression of PfGSK3-GFP in late stage parasites was analyzed by Western blot analysis using anti-GFP specific antibodies. Anti-Aldolase specific antibodies were used as a loading control. (C,D) Epifluorescence (C) and confocal (D) localization of PfGSK3-GFP in late trophozoites (LT) schizonts (S) and merozoites (M) revealed perinuclear and cytosolic distribution. Nuclei are stained with DAPI (blue). Scale bars, 2 μm. E. SDS-PAGE and autoradiograph of in vitro phosphorylation samples (upper panel) as well as coomassie stained loading (lower panel) of AMA1WT and AMA1PM incubated with human GSK3β (hGSK3β). (F) Differential in vitro phosphorylation of AMA1 variants with single phosphorylation sites (AMA1S588, AMA1S601, AMA1S610, AMA1T612, AMA1T613) by hGSK3β. SDS-PAGE and autoradiograph of the in vitro phosphorylation samples (upper panel) as well as coomassie stained loading (lower panel) are shown.
Figure 4
Figure 4. S610 phosphorylation is a prerequisite for efficient T613 is phosphorylation.
(A) Autoradiograph of in vitro phosphorylation samples (upper panel) as well as coomassie stained loading (lower panel) are shown. AMA1 variants displaying either all (AMA1WT), none (AMA1PM) or only single phosphorylation sites (AMA1S610, AMA1T612, AMA1T613) were incubated with schizont material in the presence of cAMP and 32P-γ-ATP. (B) Phosphorylation of PKA pre-phosphorylated AMA1WT and mutants AMA1PM and AMA1S610/T613. Recombinant proteins were first incubated with PKA in the presence of non-labeled ATP. Subsequently, these pre-treated AMA1 were incubated with either PKA or a schizont extract in the presence of 32P-γ-ATP. AMA1PM was used as a control. SDS-PAGE and radiograph of in vitro phosphorylation samples (upper panel) as well as coomassie stained loading (lower panel) are shown. (C) In vitro phosphorylation of AMA1-GST fusion variants (AMA1WT, AMA1S610, AMA1S610/T613) either as unphosphorylated (-) or PKA-pre-phosphorylated (+) substrates in the presence of recombinant PfGSK3β and 32P-γ-ATP or without the addition of PfGSK3β (c). (D) Signal intensities were quantified. Error bars correspond to standard deviation of two independent experiments done in triplicates. (E) Sandwich ELISA demonstrating 5v-induced inhibition of native AMA1 threonine phosphorylation. Parasites were treated with 5v and a rabbit anti-PfAMA1 antibody was used to capture PfAMA1 from culture lysates. Threonine phosphorylation was detected in an ELISA format using a mouse anti-phosphothreonine antibody. Histograms were generated after normalizing against uninfected (0%, background) and untreated (100%) culture signals. Phosphatase-treatment was used to denote zero phosphorylation and chloroquine treatment was used to exclude parasite growth arrest as a cause for reduced phosphorylation. (F) The PfPKA inhibitor H89, weakly inhibited egress and strongly inhibited invasion in P. falciparum reporter parasites transfected with secreted Nanoluciferase. Luciferase activity in relative light units was measured and dose-response curves were plotted for egress (dashed line) and invasion (solid line) after normalizing against uninfected (0%) and untreated (100%) culture sample signals. Two biological replicates were performed in triplicate; error bars denote one standard deviation. (G) The PfGSK inhibitor 5v strongly inhibits invasion. The experiment was performed as per F.

References

    1. World Health Organization. World Malaria Report 2014 (World Health Organization, 2014).
    1. Gilson P. R. & Crabb B. S. Morphology and kinetics of the three distinct phases of red blood cell invasion by Plasmodium falciparum merozoites. Int J Parasitol 39, 91–96, 10.1016/j.ijpara.2008.09.007 (2009). - DOI - PubMed
    1. Treeck M. et al.. Functional analysis of the leading malaria vaccine candidate AMA-1 reveals an essential role for the cytoplasmic domain in the invasion process. PLoS Pathog 5, e1000322, 10.1371/journal.ppat.1000322 (2009). - DOI - PMC - PubMed
    1. Harvey K. L., Gilson P. R. & Crabb B. S. A model for the progression of receptor-ligand interactions during erythrocyte invasion by Plasmodium falciparum. Int J Parasitol 42, 567–573, 10.1016/j.ijpara.2012.02.011 (2012). - DOI - PubMed
    1. Sharma P. & Chitnis C. E. Key molecular events during host cell invasion by Apicomplexan pathogens. Curr Opin Microbiol 16, 432–437, 10.1016/j.mib.2013.07.004 (2013). - DOI - PubMed

Publication types

MeSH terms

LinkOut - more resources