. 2016 Oct 27;538(7626):510-513.
doi: 10.1038/nature19844. Epub 2016 Oct 3.

Genomic insights into the peopling of the Southwest Pacific

Affiliations

Genomic insights into the peopling of the Southwest Pacific

Pontus Skoglund et al. Nature. .

Abstract

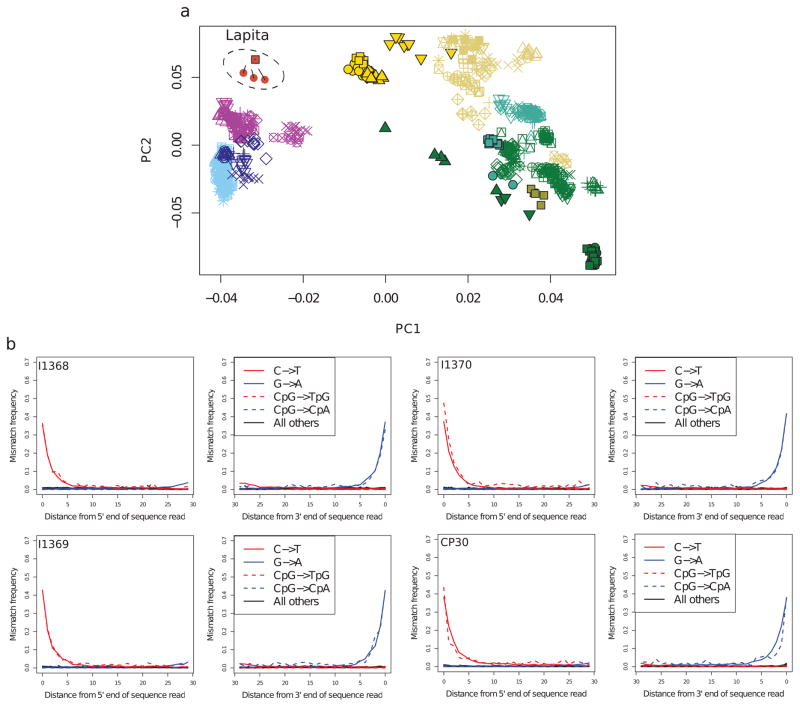
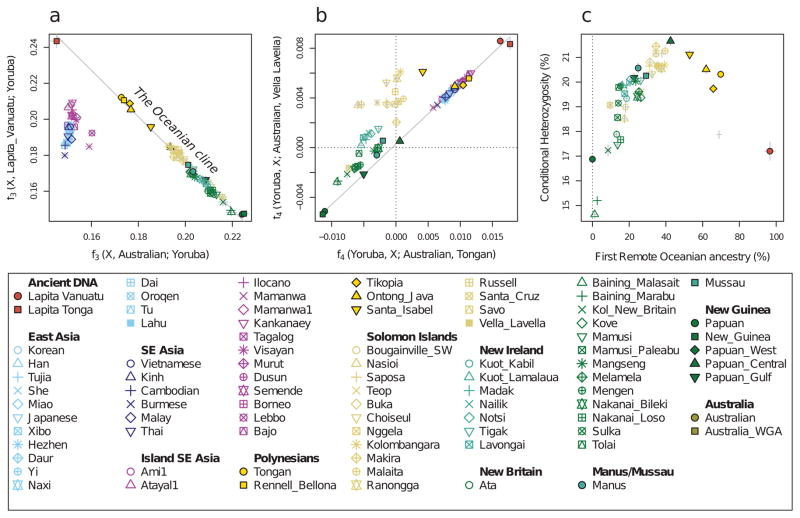
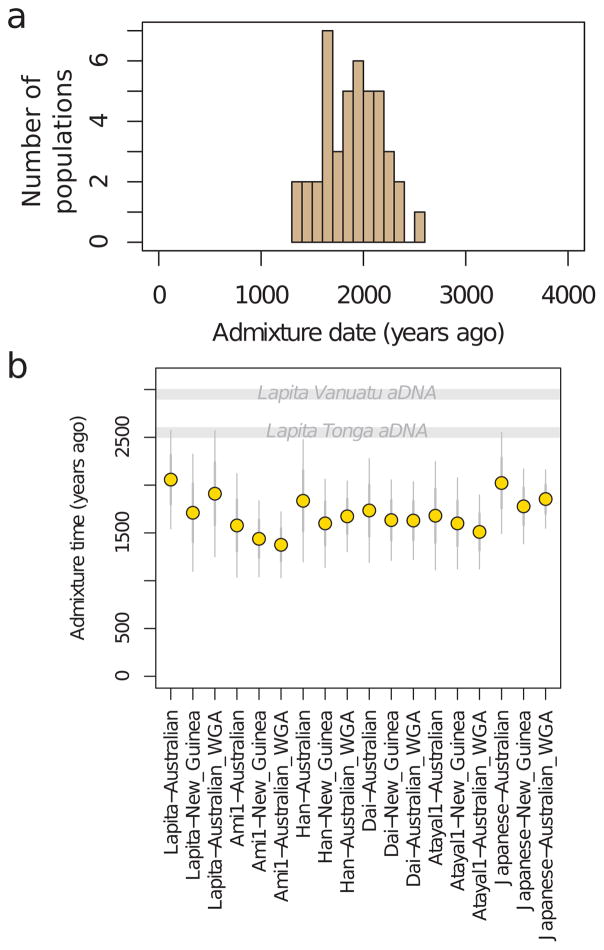
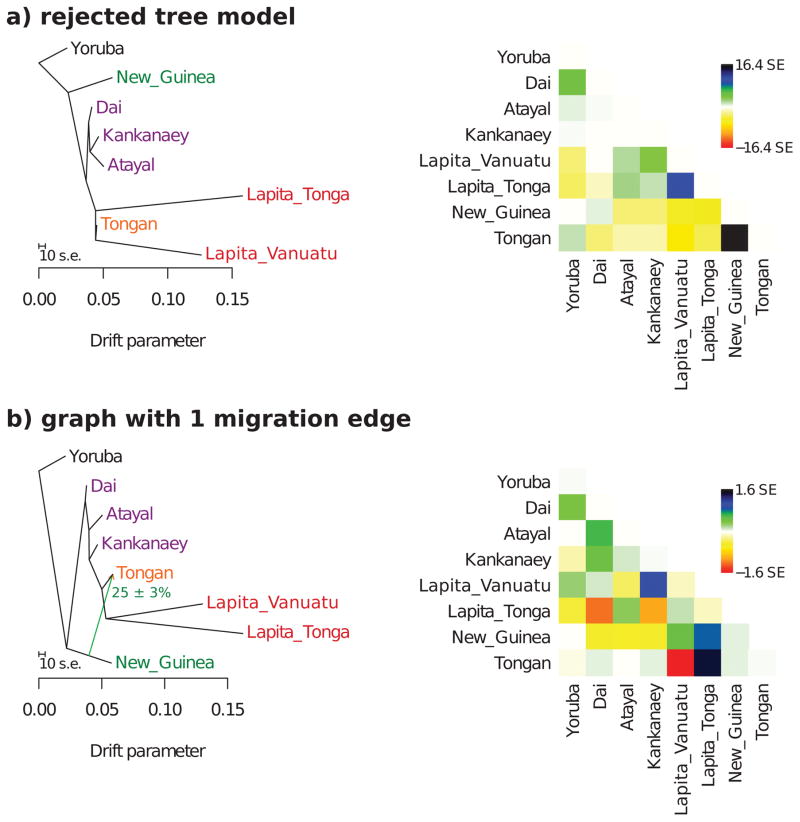
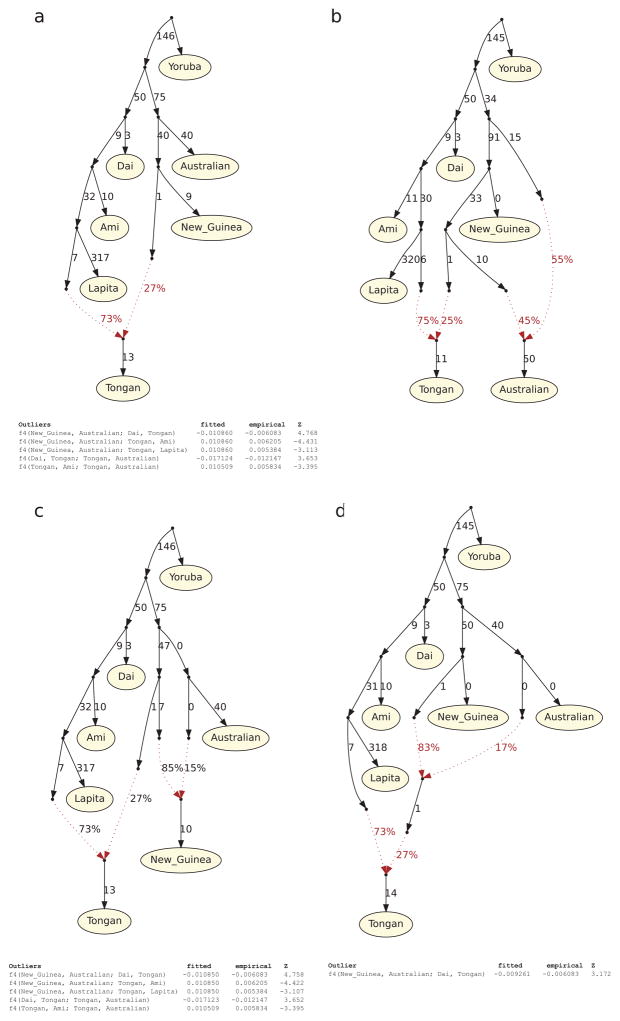
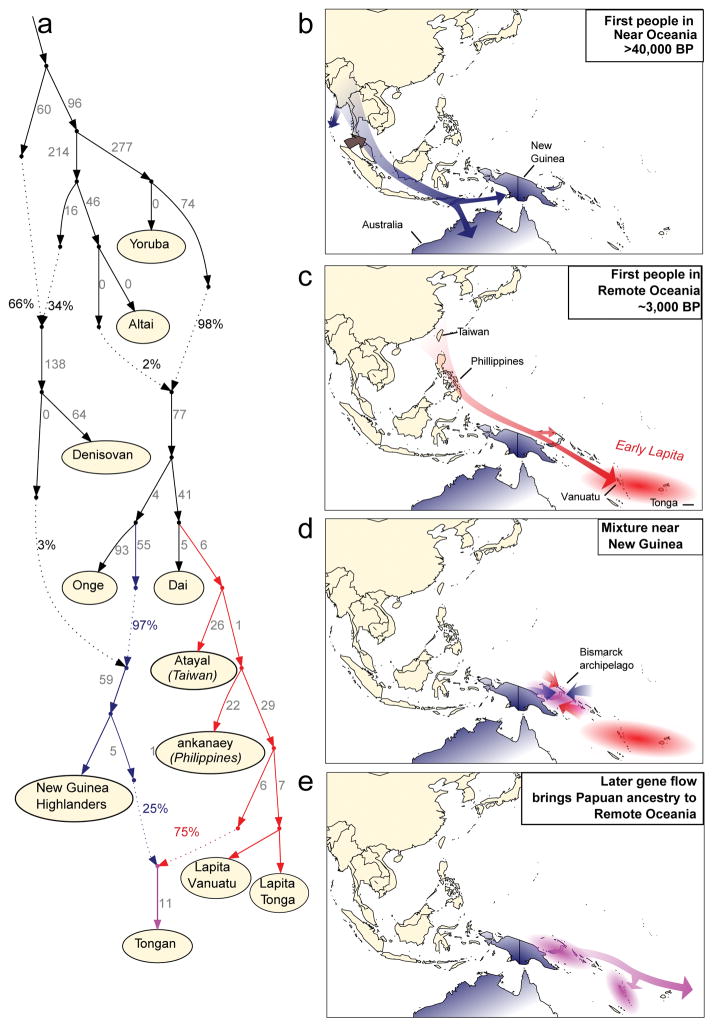
The appearance of people associated with the Lapita culture in the South Pacific around 3,000 years ago marked the beginning of the last major human dispersal to unpopulated lands. However, the relationship of these pioneers to the long-established Papuan people of the New Guinea region is unclear. Here we present genome-wide ancient DNA data from three individuals from Vanuatu (about 3,100-2,700 years before present) and one from Tonga (about 2,700-2,300 years before present), and analyse them with data from 778 present-day East Asians and Oceanians. Today, indigenous people of the South Pacific harbour a mixture of ancestry from Papuans and a population of East Asian origin that no longer exists in unmixed form, but is a match to the ancient individuals. Most analyses have interpreted the minimum of twenty-five per cent Papuan ancestry in the region today as evidence that the first humans to reach Remote Oceania, including Polynesia, were derived from population mixtures near New Guinea, before their further expansion into Remote Oceania. However, our finding that the ancient individuals had little to no Papuan ancestry implies that later human population movements spread Papuan ancestry through the South Pacific after the first peopling of the islands.


Conflict of interest statement

The authors declare no competing financial interests. Readers are welcome to comment on the online version of the paper

Figures

Extended Data Figure 1
Extended Data Figure 1. Ancient DNA authenticity
a, Principal component analysis performed as for Figure 1, but with the four ancient individuals represented only by sequences that show clear evidence of postmortem damage (PMD score of at least 3) to remove contaminating sequences that might be present,. The numbers of SNPs remaining after restricting to damaged sequences is 68,450 SNPs for I1368; 98,722 SNPs for I1369; 83,024 SNPs for I1370; and 117,023 SNPs for CP30. The lines indicate the projection of the samples when no damage-restriction is performed. The large number of SNPs retained, and the fact that the ancient individuals cluster tightly and have the same qualitative positioning in the plot as Figure 1, indicates that contamination is not contributing to our findings. We also find that estimates of Papuan ancestry using PMD score restricted data is consistent with those obtained using the full data (Methods). b, Postmortem damage patterns for genome-wide in-solution enrichment data from four ancient individuals.
Extended Data Figure 2
Extended Data Figure 2. f-statistics document the Oceanian ancestry cline
a, Shared genetic drift with Lapita_Vanuatu is negatively related to shared drift with Australians. Except for Lapita_Tonga, populations from Taiwan, the Philippines and Polynesia share the most genetic drift with the Lapita_Vanuatu, who are not shown in the plot because they are used as reference in the computation. The trend line was fitted without the East Asian populations in the off-cline cluster. b, The Lapita_Vanuatu and Lapita_Tonga maximize statistics of the form f4(Yoruba, Test; Australian, Oceanian), suggesting that they are the most closely related to the East Asian ancestry in Oceanians of any sampled population. The trend line was fitted using populations >0.005 on the x-axis, together with the two populations with the lowest values on the x-axis (Papuan and New_Guinea). c, biplot of First Remote Oceanian ancestry proportions against conditional heterozygosity. Populations with intermediate admixture proportion show the greatest genetic diversity. Thick and thin error bars in all panels are 1, and 1.96 standard errors of the estimate, respectively.
Extended Data Figure 3
Extended Data Figure 3. Admixture date estimates
a, histogram of the point estimate dates in Figure 2d. b, Admixture date estimates for Tongans using different pairs of source populations (“Lapita” in this figure refers to Lapita_Vanuatu). Error bars show 1 (thick whiskers) and 1.96 (thin whiskers) standard errors, respectively. (“WGA” refers to whole-genome amplified DNA.)
Extended Data Figure 4
Extended Data Figure 4. Admixture graph inferred using Treemix
a, A simple tree-like model without admixture fits the data poorly, as can be seen from the matrix of residuals between empirical and modeled allele frequency covariance on the right. b, The optimal placement of a single 25% admixture event is from the lineage related to New Guinean Highlanders into the lineage leading to Tongans. Tongans derive the other portion of their ancestry from the lineage leading to the two ancient groups of individuals. This graph has no significant deviations between empirical and modeled allele frequency covariances.
Extended Data Figure 5
Extended Data Figure 5. Admixture graphs modeling the population history of Australians
Outlier f4-statistics are shown (|Z| > 3). a, A model with a single admixture edge positing that Australians are an outgroup to the Papuan ancestry in Tongans does not fit the data (5 outlier statistics). b, An alternative model with 2 admixture edges where the Papuan ancestry in Tongans also contributed to Australians fits the data (no outliers). c, A model with 2 admixture edges where New Guinean Highlanders are admixed from an Australian source after the divergence of the Papuan source in Tongans does not fit the data (5 outliers). d, A model with 2 admixture edges where the Papuan ancestry in Tongans is intermediate between the New Guinean Highlander lineage and the Australian lineage. Branch lengths are in units of FST × 1000. Lapita in this figure refers only to Lapita_Vanuatu, which is the only group for which we have multiple individuals (needed to compute FST).
Extended Data Figure 6
Extended Data Figure 6. First Remote Oceanian ancestry today comes primarily from females
a, Illustration of the rationale for using the X-chromosome to study asymmetrical admixture between males and females. The example on the left illustrates admixture with equal proportion of males and females in both the red and the yellow ancestral population. The example on the right illustrates an extreme case of asymmetrical admixture where the red ancestral population only contributes females and the yellow ancestral population only contributes males to the admixed generation, demonstrating the disproportional contribution of X chromosomes by females to the admixed population. b, Female and male ancestral contributions based on an admixture model fitted to estimated ancestry proportions on the autosomes and X-chromosome. We show the 95%, 70%, and 5% highest posterior intervals for four selected populations from Polynesia (Samoans), the Solomon Islands (Kolombangara), Bougainville (Nasioi), and mainland New Guinea (Papuans).
Figure 1
Figure 1. Data from ancient and present-day populations
a, Locations of 778 present-day individuals genotyped on the Affymetrix Human Origins Array and 4 ancient individuals. b, Ancient individuals projected onto principal component 1 and 2 computed using only present-day samples. Individual population labels are given in Extended Data Figure 2.
Figure 2
Figure 2. Genetic characteristics of the Oceanian ancestry cline
a, Estimated proportion of First Remote Oceanian ancestry. b, Difference between First Remote Oceanian ancestry estimates on chromosome X and the autosomes. c, Denisovan ancestry estimates are inversely related to First Remote Oceanian ancestry estimates. d, Estimated date of admixture in all populations with at least 4 individuals and significant evidence of decay of weighted admixture linkage disequilibrium as measured in ALDER. We used Han and New Guinean Highlanders as surrogates for the ancestral populations. We assumed a generation interval of 28.1 years, and show 95% confidence intervals (thin whiskers) incorporating uncertainty both in the ALDER date and the value of the human generation interval. We show the range of radiocarbon dates for the ancient individuals. e, Conditional heterozygosity (genetic diversity) estimated by drawing two random chromosomes from different individuals at each locus, using only SNPs ascertained in a single Yoruba, and restricting to transversion SNPs to avoid any concerns about inflated heterozygosity due to ancient DNA degradation. Thick and thin error bars in all five panels correspond to 1, and 1.96 standard error of the estimate.
Figure 3
Figure 3. A model of population history
a, A model of population relationships incorporating admixture that fits the allele frequency patterns (all empirical f-statistics within 3 standard errors of expectation). Branch lengths are shown in units of FST × 1000. b, A model of population movements more than 40,000 years ago in which modern humans arrived in the Australia-New Guinea region (blue shading) and mixed with archaic Denisovans (brown shading). c, A model of events prior 3,000 years ago, in which the First Remote Oceanian population formed by spread of a population of ultimate East Asian origin to a region including Vanuatu and Tonga, and experienced little or no mixture with the Papuans they encountered along their journey (red shading). Note that geographic routes are speculative. d, A model of populations of mixed Papuan-First Remote Oceanian ancestry in Near Oceania after 3,000 years ago in a patchwork of islands with different proportions of First Remote Oceanian ancestry (pink shading). e, A model of secondary expansion of admixed populations bringing Papuan ancestry into Remote Oceania, which was still not complete in Tonga by the date of the Talasiu individual at 2680-2340 BP.

References

    1. Sheppard PJ, Chiu S, Walter R. Re-dating Lapita Movement into Remote Oceania. Journal of Pacific Archaeology. 2015;6:26–36.
    1. Kayser M, et al. Genome-wide Analysis Indicates More Asian than Melanesian Ancestry of Polynesians. The American Journal of Human Genetics. 2008;82:194–198. http://dx.doi.org/10.1016/j.ajhg.2007.09.010. - DOI - PMC - PubMed
    1. Kayser M. The human genetic history of Oceania: near and remote views of dispersal. Current Biology. 2010;20:R194–R201. - PubMed
    1. Wollstein A, et al. Demographic history of Oceania inferred from genome-wide data. Current Biology. 2010;20:1983–1992. - PubMed
    1. Matisoo-Smith E. Ancient DNA and the human settlement of the Pacific: A review. Journal of Human Evolution. 2015;79:93–104. http://dx.doi.org/10.1016/j.jhevol.2014.10.017. - DOI - PubMed

Publication types

LinkOut - more resources