. 2016 Nov;21(11):1573-1588.
doi: 10.1038/mp.2016.158. Epub 2016 Oct 4.

Predicting the functional states of human iPSC-derived neurons with single-cell RNA-seq and electrophysiology

Affiliations

Predicting the functional states of human iPSC-derived neurons with single-cell RNA-seq and electrophysiology

C Bardy et al. Mol Psychiatry. 2016 Nov.

Abstract

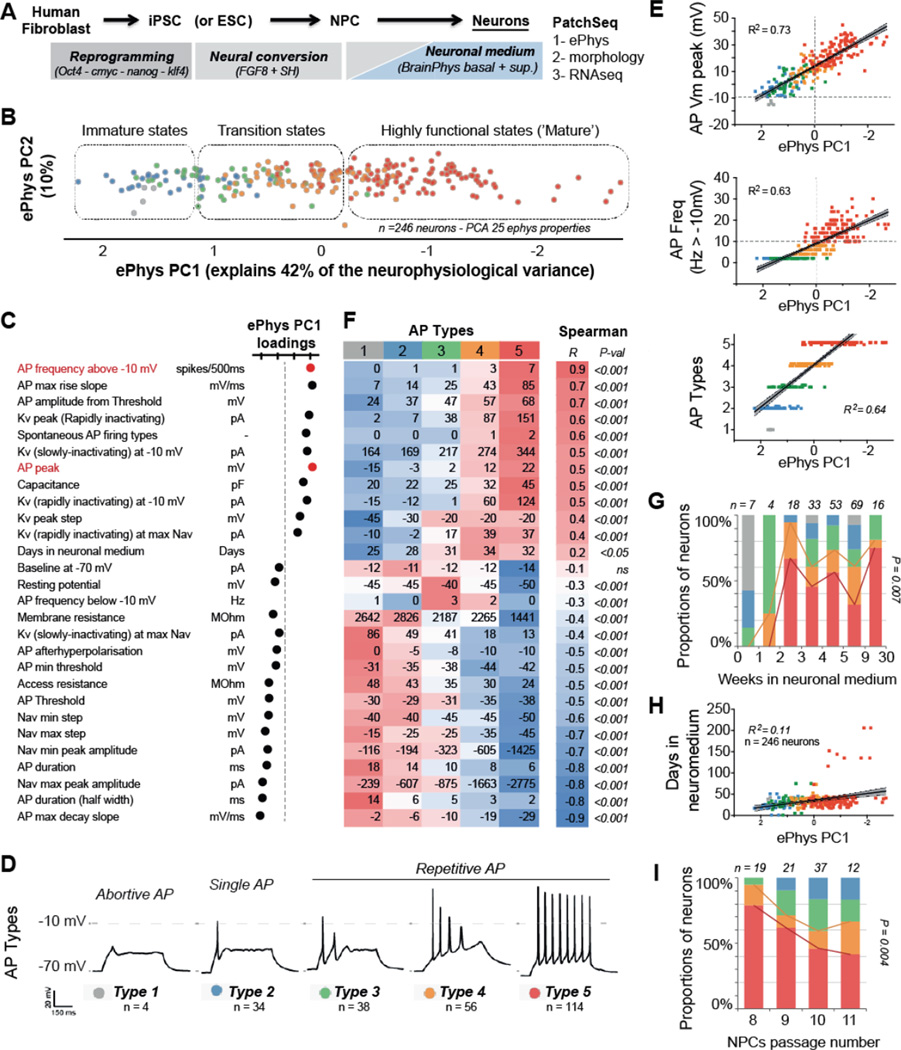
Human neural progenitors derived from pluripotent stem cells develop into electrophysiologically active neurons at heterogeneous rates, which can confound disease-relevant discoveries in neurology and psychiatry. By combining patch clamping, morphological and transcriptome analysis on single-human neurons in vitro, we defined a continuum of poor to highly functional electrophysiological states of differentiated neurons. The strong correlations between action potentials, synaptic activity, dendritic complexity and gene expression highlight the importance of methods for isolating functionally comparable neurons for in vitro investigations of brain disorders. Although whole-cell electrophysiology is the gold standard for functional evaluation, it often lacks the scalability required for disease modeling studies. Here, we demonstrate a multimodal machine-learning strategy to identify new molecular features that predict the physiological states of single neurons, independently of the time spent in vitro. As further proof of concept, we selected one of the potential neurophysiological biomarkers identified in this study-GDAP1L1-to isolate highly functional live human neurons in vitro.


Conflict of interest statement

The authors declare no conflicts of interest.

Figures

Figure 1
Figure 1. Electrophysiological states heterogeneity of human neurons in culture
A. Human ESCs (H9) or iPSCs from healthy subjects were converted to neuronal progenitor cells (NPCs). Neurons and astrocytes derived from the same progenitors were then cultured in neuronal medium (BrainPhys basal medium with supplements). See methods for more details. B. Principal component analysis (PCA) of 25 electrophysiological properties (listed in panel C) measured with patch clamping of human neurons (n=246). This PCA integrates basic cell-intrinsic electrophysiological properties such as passive membrane properties, voltage-dependent sodium and potassium currents and APs firing. Each dot represents a neuron. Astrocytes or any cells that did not express at least small voltage-dependent sodium currents were not included in the PCA. Cells that did not have unambiguous analysis of all the chosen 25 properties were also excluded from this PCA. C. The dot graph represents the relative values of the loadings onto the first principal component (PC1) for each of the 25 properties used in the above PCA. The loadings highlighted in red correspond to the two measures that were used subsequently to define a continuum of five functional states. D. Representation of the typical heterogeneous neuronal responses to optimal depolarizing current steps for 500 ms (Vm rest clamped around −70mV). We classified those heterogeneous states of differentiated neurons into a continuum of five AP Types based on the combination of key electrophysiological properties identified with unbiased PCA: 1) the maximal peak of AP (Vm measured at the top of the best evoked AP), and 2) the frequencies of APs overshooting −10mV. The same neuronal color key throughout the figure corresponds to this AP Types classification (see also Figure S2B). E. The graphs show the PC1 value for each neuron (n = 246) against the key AP properties and the corresponding AP Type classification. EPhys PC1 values highly correlate with the maximum peak and frequencies of APs (evoked APs freq were counted only if overshooting −10 mV in response to a square pulse of current of 500 ms from resting −70mV). Linear regression fits ± 95% confidence intervals are shown. F. Most measurements listed on each row significantly correlate with the AP Types classification (columns 1–5 of heat map). The values in the central heat map represent the median for the neurons in respective AP Type categories. To illustrate the direction of the measurement variations between AP Types, we color coded the heat map (values normalized by row with mean = 0 and variance = 1) from low to high values (blue, to white, to red). The last two columns show the Spearman’s correlation coefficient (R) and its significance (P-val) between the measurements (row) vs. the numerical class (1–5) of AP types. The properties were sorted by decreasing correlation coefficient obtained. The p-values were corrected for multiple hypothesis testing [Bonferroni correction: P<0.05 (2E-03), P<0.01 (3E-04), P<0.001 (3E-05)]. G. The differentiated neurons were patch clamped after different periods in neuronal medium. Days were counted from the switch of neuronal progenitor medium to neuronal medium (BrainPhys basal + supplements from 0 to up to 7 months). The proportion of more functional neurons (Type 4 and 5) significantly increased the first 3 weeks in neuronal medium, implying that an early maturation phase corresponds with the development of electrophysiological types; however, the proportions of Type 4 and 5 appeared to plateau after that period. The significance of this relationship in single neurons was measured with Spearman correlation between days in neuronal medium (x-axis) and the numerical class (1–5) of AP types. H. We found a significant but poor correlation of the time spent in neuronal medium and functional states (measured by ePhys PC1 or AP types). I. After expansion (six passages) and storage at −80°C, NPCs derived from the same cell line (H9) were thawed and cultured for another two to five passages before re-plating in neuronal medium. The neurons (n=89) were patch clamped after 4–6 weeks in neuronal medium and categorized into AP types. The proportion of Type 5 neurons significantly decreased with high NPC passage numbers. The significance of this relationship in single neurons was measured with Spearman correlation between passage numbers (x-axis) and the numerical class (1–5) of AP types.
Figure 2
Figure 2. Synaptic input activity highly correlates with AP states
A. Frequency distribution of AP Types and differentiated neurons with active synaptic inputs against the ePhys PC1 measure in Figure 1B. B. The trace represents typical spontaneous (Spont) AMPA events (NBQX-sensitive). Patched neurons were classified as synaptically active (active synaptic inputs) in the left histogram if more than three clear glutamatergic spontaneous events were detected (with typical AMPA kinetics and amplitude above noise levels) within 5-min recordings in voltage clamp close to the reversal potential of Cl channels (−70 mV). C. The trace represents typical spontaneous GABA events (Gabazine-sensitive). Patched neurons were classified as pre-synaptically active in the left histogram if more than three clear GABAergic spontaneous events were detected (with typical GABA kinetics and amplitude above noise levels) within 5-min recordings in voltage clamp close to the reversal potential of Na+ channels (0 mV). B, C. Mean±SEM shown. For the spontaneous events amplitudes, the medians were 13% lower than mean but strongly correlated (R2 = 0.90, P<0.0001). For each graph a linear regression was fitted and the significant p-values were noted in brackets with R2 and n. Non-significant regression fit p-values >0.05 were noted as ‘(ns)’. Additional statistics between individual types were performed with Mann Whitney two-tailed test, and only the significant p-values from these tests were noted in the graphs above each compared group.
Figure 3
Figure 3. Morphological features that correlate with AP states
A. Stitched photos of a live patched neuron, which was filled with rhodamine (left) and morphogically reconstructed with Neurolucida (right). B. Correlation of morphological measurements (rows) with AP Types (columns 1–5). The values in the central heat map represent the median for the neurons in respective AP Type categories. To illustrate the direction of the measurement variations between AP Types, we color coded the heat map (values normalized by row with mean = 0 and variance = 1) from low to high values (blue, to white, to red). The last two columns show the Spearman correlation coefficient (R) and significance (P-val) of Spearman’s rank correlation between the electrophysiological measures (row) and the numerical class (1–5) of ePhys Type. The properties were sorted by decreasing correlation coefficient. C. Mean soma diameter significantly increased in more functional AP Types. D. Sholl analysis revealed that more functional AP Types had significantly more complex dendritic/axonal arborization. Mann-Whitney U two-tailed tests were performed at 20, 50 and 100 um between different types. The dendritic complexities of Type 4 and 5 neurons were not significantly different, and the complexity between Types 1, 2, 3 was not either. However, Types 4 and 5 were significantly more complex than Types 1, 2, 3. Mean± SEM shown. E. The capacitance significantly increased in more functional AP Types of neurons. Significance threshold was P<0.05. Mann-Whitney U two-tailed p-values are shown in D, E and F.
Figure 4
Figure 4. Whole single-cell RNA-seq of patch-clamped neurons (PatchSeq)
A. The photos show an example of neuronal culture stained with GFP before and after a single neuron was patched and collected for transcriptome analysis. For every cell included in the analysis, the entire neuron was collected, including the soma/nucleus and neurites. The photos permitted us to confirm that only the patched neuron filled with rhodamine was collected, leaving the surrounding tissue intact. B. Following electrophysiological and morphological analyses of live neurons, the single cells were collected and their transcriptome processed for deep sequencing, bioinformatics processing and statistical analysis. QC, quality control. C, D. Housekeeping genes such as ACTB and GAPDH were detected in every cell. Their expression levels were not significantly different between types of neurons and astrocytes. E. Significantly more genes were expressed in astrocytes and Type 5 neurons compared to the other neuronal types. Asterisks represent Mann Whitney p-values <0.05. F. The number of detected genes above 5 tpm did not significantly correlate with the size of the neurons, estimated here by capacitance. The AP Types are color coded in the graph (red T5, orange T4, green T3, blue T2, gray T1).
Figure 5
Figure 5. Single-cell transcriptomes segregate functional states of differentiated neurons
Unbiased and unsupervised analysis was performed on the transcriptome (17,757 genes detected >5 tpm in at least one cell) on a sample of 56 whole single-cells (including nucleus, soma and distant neurites), which passed all QC. This sample comprised 50 differentiated neurons displaying Nav currents and 6 astrocytes expressing GFAP:GFP. A. Unsupervised clustered heatmap of cell-to-cell transcriptome correlations (Euclidean distances). The linkage distances of the hierarchical clustering represent an estimate of the quality of the unbiased/unsupervised clusters. B. Unsupervised principal component analysis on the entire single-cell transcriptomes. Cell transcriptome profiles (symbols) are represented in a two-dimensional principal component space. These unsupervised analyses reveal molecular segregation between groups of neurons in highly functional states (almost all AP Type 5 – 85%), less functional neurons in ‘transition states’ (mix of different AP types with significantly less Type 5 – 15%) and astrocytes. Furthermore, the functional molecular clusters surpassed transcriptional differences between iPSC lines from different subjects and even an ESC line. C. Monocle analysis illustrates the progress through functional states by pseudotemporal ordering of single-cell mRNA expression profiles. Cell expression profiles (points) are represented in a two-dimensional independent component space. Lines connecting points represent edges of the minimum spanning tree constructed by monocle. Solid black line indicates the main diameter path of the minimum spanning tree and provides the backbone of monocle’s pseudotime ordering of the cells based on molecular profiles. D. The expression of five key genes in 20 sequenced Type 5 neurons was normalized and compared to determine their neurotransmitter identity. Most cells could be classified as either glutamatergic, GABAergic, dopaminergic, orserotonergic and a few cells remained undefined. E. Heatmap of single-cell gene expression levels. The genes were selected and grouped based on known neuronal functions. For comparison, AP Type 5 genes identified in the present study are in red/bold. See also Figure S5B. F. Genes significantly correlating with numerical AP Types classification by Spearman’s rank correlation coefficient (P<0.001).
Figure 6
Figure 6. Machine-learning tree classifiers predict functional states of neurons based on single-cell transcriptome and reveal potential biomarkers
A. Extremely Randomized Trees (ERT) classifier built with the transcriptome of 56 single cells and trained with electrophysiological data. Actual classes were attributed by electrophysiological measurements. Predicted classes were attributed by the machine-learning algorithm based on single-cell transcriptomes. B–D. Each ERT classifier was trained to categorize the cells in two functional classes. Classifier B was trained to predict AP Types 4–5 in a mixed group of cells including differentiated neurons and astrocytes. Classifier C was trained to predict Type 5 neurons from other differentiated neurons. Classifier D was trained to predict highly functional (HF) neurons from other differentiated neurons in transitional states determined by the PCA clusters. The lists show the top 45 genes selected by the ERT classifier with the highest gini scores. The green heatmap columns represent the normalized importance of each gene attributed by the classifier (Gini score). The blue-red heatmap matrices represent the mean expression normalized (mean 0 and variance 1) of each gene from high (red) to low (blue) in actual cell types. The genes were ordered by Euclidean clustering of the gene expression by actual functional states. Confusion matrices are displayed below the heatmaps. The confusion matrices values represent the numbers of cells in each category. Predictions were annotated with a green checkmark if correct and a red cross if false. The test-fold score for each cell was recorded and a score histogram was computed for each cell group (blue and red bars). Classes were predicted with a determined classifier score split, indicated by a gray dashed line in the histograms. See also Figure S6.
Figure 7
Figure 7. Biomarkers to isolate highly functional Type 5 neurons
A. The top 16 genes expressed mostly in Type 5 neurons. The genes were selected based on the combination of several criteria: OFF (<10 tpm) in all astrocytes, OFF in >70% of Types 1–2–3 neurons, OFF in >50% of Type 4 neurons, ON (>10 tpm) in >50% Type 5 neurons and then by the genes significantly more expressed in Type 5 versus all other cell types (p-values from a Mann Whitney test). The selected genes were then ordered by p-values and the most significant 16 genes are shown (P<0.001). Significance was tested with two-tailed Mann-Whitney U test between Type 5 neurons and all the other cells. The expression of the top two genes was plotted. Each gray point represents a single neuron. The red curve is the mean±SEM. In the bottom charts black bars represent the proportion of cells in each cell type group with ON expression (>10 tpm). B, C. Immunostainings of fixed human neuronal cultures confirm the translation of GDAP1L1 at the protein level in some neurons (MAP2+, TUJ1+) but not in astrocytes (GFAP+). D. Example of a live human neuron expressing GFP under GDAP1L1 promoter and filled with rhodamine with the patch-clamping pipette. E. Whole-cell patch-clamp recordings from GDAP1L1-GFP neurons. The brightest GFP cells with neuronal morphology were selected for patch clamping after ~4 weeks in BrainPhys neuronal medium. The neurons expressed strong Nav/Kv currents (top left). The evoked APs were measured by slightly hyperpolarizing the cells to reduce spontaneous activity (top right). Spontaneous APs were recorded at resting membrane potential with zero current injected (middle). Spontaneous AMPA-mediated excitatory synaptic activity was recorded in voltage clamp at −70 mV (bottom). F. The electrophysiological properties of the patched GDAP1L1-GFP neurons (n=12) were mature and functional. Means±SEM shown. The properties of single neurons are represented by each dot in the graphs. APs were counted only if amplitude was above −10 mV. Spontaneous AP frequencies were measured at resting membrane potential. G. Three human neuronal cell lines, which matured for 5 weeks in BrainPhys basal + supplements, were infected with LV GDAP1L1:EGFP for 5 days before being dissociated, fixed and stained. Healthy cells not expressing GFAP (GFAP-neg; top graphs) were analyzed for their expression of TRAPPC6B protein and LV GDAP1L1:GFP expression (bottom graphs). The green rectangles highlight the cells expressing high levels of GFP under GDAP1L1 promoter and high levels of TRAPPC6B protein. The proportion of presumably mature ePhys types of neurons varied highly between the three cell lines. H. Using two lentiviral vectors we sorted live astrocytes and live neurons from IPSC#1 after 5 weeks in BrainPhys and replated them on glass coverslips for 4 days before electrophysiological evaluation. The population of neurons expressing high levels of GFP under GDAP1L1 promoter (and no GFAP:tdTomato) were patched and all the cells were classified as highly functional neurons (n=5) with on average high evoked firing frequencies (16±2Hz), low resting potentials (−58±2 mV), and large AP amplitude (91±4 mV).

References

    1. Greig LC, Woodworth MB, Galazo MJ, Padmanabhan H, Macklis JD. Molecular logic of neocortical projection neuron specification, development and diversity. Nat Rev Neurosci. 2013;14:755–769. - PMC - PubMed
    1. Molyneaux BJ, Arlotta P, Menezes JRL, Macklis JD. Neuronal subtype specification in the cerebral cortex. Nat Rev Neurosci. 2007;8:427–437. - PubMed
    1. Cho M-S, Hwang D-Y, Kim D-W. Efficient derivation of functional dopaminergic neurons from human embryonic stem cells on a large scale. Nat Protoc. 2008;3:1888–1894. - PubMed
    1. Vadodaria KC, Mertens J, Paquola A, Bardy C, Li X, Jappelli R, et al. Generation of functional human serotonergic neurons from fibroblasts. Molecular Psychiatry. 2015 - PubMed
    1. Shi Y, Kirwan P, Smith J, Robinson HPC, Livesey FJ. Human cerebral cortex development from pluripotent stem cells to functional excitatory synapses. Nat Neurosci. 2012 - PMC - PubMed

Publication types