. 2016 Dec;21(12):1663-1671.
doi: 10.1038/mp.2016.165. Epub 2016 Oct 4.

Caspr2-reactive antibody cloned from a mother of an ASD child mediates an ASD-like phenotype in mice

Affiliations

Caspr2-reactive antibody cloned from a mother of an ASD child mediates an ASD-like phenotype in mice

L Brimberg et al. Mol Psychiatry. 2016 Dec.

Abstract

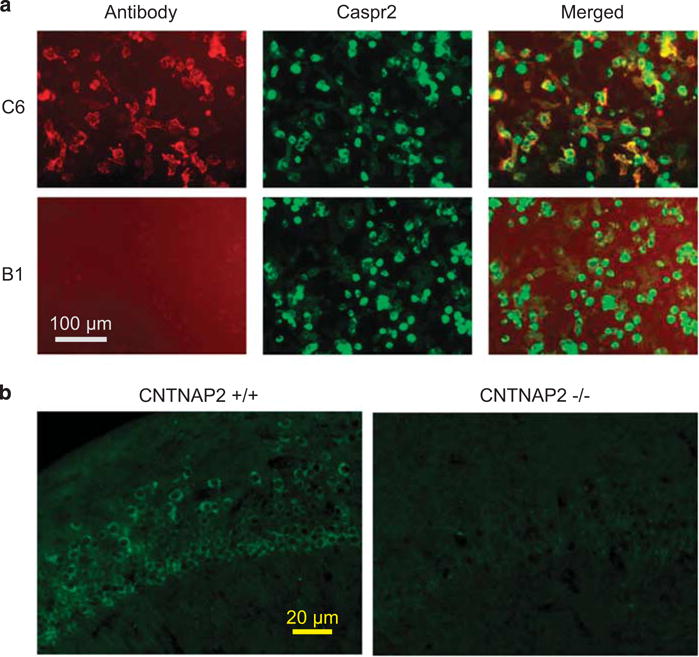
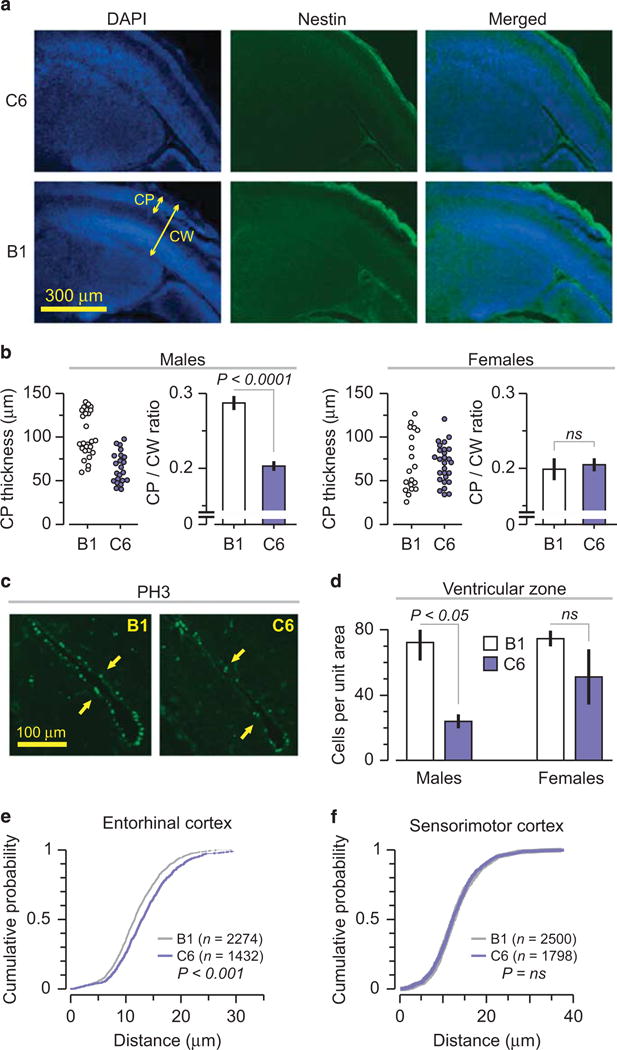
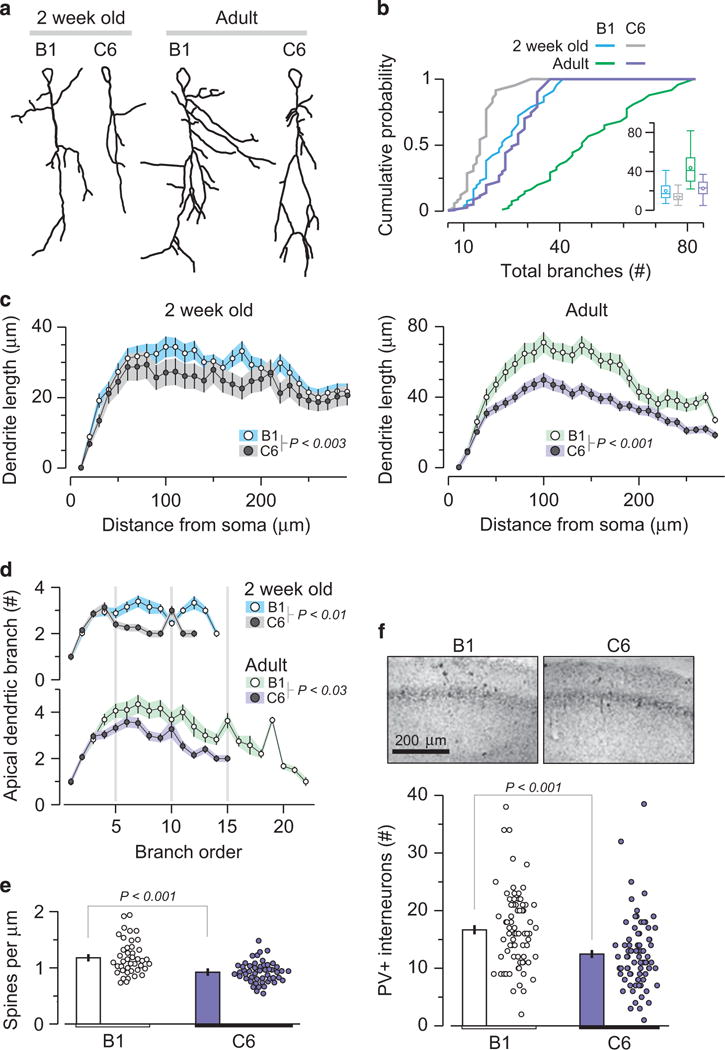
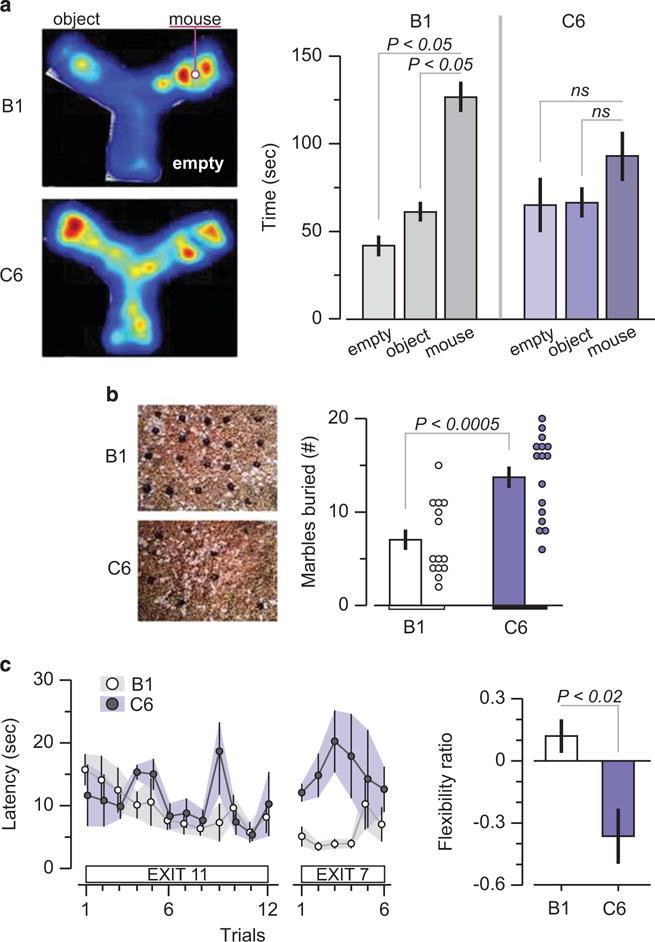
Autism spectrum disorder (ASD) occurs in 1 in 68 births, preferentially affecting males. It encompasses a group of neurodevelopmental abnormalities characterized by impaired social interaction and communication, stereotypic behaviors and motor dysfunction. Although recent advances implicate maternal brain-reactive antibodies in a causative role in ASD, a definitive assessment of their pathogenic potential requires cloning of such antibodies. Here, we describe the isolation and characterization of monoclonal brain-reactive antibodies from blood of women with brain-reactive serology and a child with ASD. We further demonstrate that male but not female mice exposed in utero to the C6 monoclonal antibody, binding to contactin-associated protein-like 2 (Caspr2), display abnormal cortical development, decreased dendritic complexity of excitatory neurons and reduced numbers of inhibitory neurons in the hippocampus, as well as impairments in sociability, flexible learning and repetitive behavior. Anti-Caspr2 antibodies are frequent in women with brain-reactive serology and a child with ASD. Together these studies provide a methodology for obtaining monclonal brain-reactive antibodies from blood B cells, demonstrate that ASD can result from in utero exposure to maternal brain-reactive antibodies of single specificity and point toward the exciting possibility of prognostic and protective strategies.


Conflict of interest statement

CONFLICT OF INTEREST

The authors declare no conflict of interest.

Figures

Figure 1
Figure 1
Brain-reactive monoclonal antibody C6 binds to Caspr2. (a) C6 (top panels), but not control B1 (bottom panels) antibody co-localize with Caspr2 on HEK-293T cells, expressing tGFP-Caspr2. No staining was seen on cells expressing only tGFP or non-transfected cells (data not shown). (b) C6 antibodies show reduced staining to the CA1 region in the hippocampus of CNTNAP2−/− (right) compared with wild-type (left) mice. Caspr2, contactin-associated protein-like 2; tGFP, turbo-green florescent protein.
Figure 2
Figure 2
Male mice exposed in utero to C6 manifest cortical abnormalities. (a–d) Number of mice included in the analysis: Male: B1 = 5, C6 = 4; Female: B1 = 5, C6 = 5. Mice were derived from two litters for each antibody. (a) The cortical plate is abnormally thin in C6-exposed (top) relative to control B1-exposed (bottom) male brains as revealed by DAPI (left) and nestin (middle) staining; CP, cortical plate; CW, cortical width. (b) (Left) Quantification of cortical plate thickness. Dots correspond to number of measurements performed (Right). The ratio of cortical plate to cortical width in male and female fetal brain; P < 0.0001, t = 7.15, t-test. (c) C6-exposed male brains (right) display fewer mitotic cells than B1-exposed male brains (left) as revealed by PH3 staining. Arrows identify regions of neurogenesis in the ventricular zone (VZ). (d) Quantification of mitotic cells (PH3+) in the VZ, Intermediate zone and sub-plate for both males and females, as indicated. Unit area = 62.5 mm2; P < 0.05, Z = 2.34, Mann-Whitney test. (e–f) Cumulative probability based on nearest neighbor analysis in five adult B1- and four adult C6-exposed mice (two litters each). Dots represent the number of cells. (e) Entorhinal cortex (Cell number: B1, n = 2274, C6, n = 1432), P < 0.001, KS. (f) Somatosensory cortex (Cell number: B1, n = 2500, C6, n = 1798), P = N.S.
Figure 3
Figure 3
C6-exposed male offspring display significantly reduced hippocampal dendritic complexity. CAI pyramidal neurons of C6-exposed male mice show reduced dendritic length and spine density. Analysis includes: 2-week-old mice (n=4 per group); neurons: B1 = 45, C6 = 49 and adult animals (n = 4 per group); neurons: B1 = 70, C6 = 83. Each group includes animals from two litters. (a) Traced drawings of representative Golgi-impregnated CA1 pyramidal neurons from 2-week-old (left) and adult (16–20-week old) (right) B1- and C6-exposed mice. (b) Cumulative probability of total number of branches. 2-week-old B1 vs C6, P < 0.003, D = 0.35, Kolmogorov-Smirnov (KS) test; adult, P < 0.001, D = 0.64, KS test. Insert, box plot, represents total number of branches, with data presented as mean and quartiles. (c) Scholl analysis depicts dendritic length as a function of distance from the soma. Left: 2-week-old mice, P < 0.005, D = 0.44, KS. Right: adult mice, P < 0.001, D = 0.97, KS test. (d) Number of dendritic branches as a function of branch order, centrifugally defined to start at the origin of the tree and continue out towards the termination, and as the number of segments traversed from the origin. The C6- and B1-exposed mice differ significantly at both ages: 2-week-old, P < 0.01, D = 0.6, KS test; adult, P < 0.03, D = 0.45, KS test. (e) Reduced density of synaptic dendritic spines in CA1 neurons in C6-exposed male mice. Dots represent individual dendrites. B1 = 1.18 ± 0.04 spines μm−1; c6 = 0.92 ± 0.02 spines μm−1; P < 0.001, t = 4.78, t-test. (f) Top, representative photomicrographs of the CA1 field showing labeled PV+ interneurons. Bottom, quantification of PV+ neurons in adult B1 (n = 1251) and C6 (n = 998) groups, P < 0.001, Z = 4.25, Mann-Whitney, four animals per group, two litters.
Figure 4
Figure 4
Impaired performance of C6-exposed male offspring in tasks that resemble core autism spectrum disorder symptoms. Maternal antibody-exposed male mice were subjected to behavioral assessment at adulthood (10–14 weeks). (a) Social approach task. (Left) representative heat map showing social patterns in B1- and C6-exposed mice. (Right) B1-exposed male mice (n = 15) displayed normal sociability, defined as spending significantly more time with the novel mouse compared with the novel object, whereas C6-exposed male mice (n = 14) spent a similar amount of time near the novel object and the novel mouse. Five litters per group. ANOVA, followed by Bonferroni test, P < 0.05. Two C6 and one B1 mouse were excluded due to a technical failure (b) Marble-burying task. (Left) representative examples of burying patterns in the two groups. (Right) C6-exposed mice (n = 16) display enhanced stereotypic behavior, that is, they bury more marbles than the B1-exposed mice (n = 14); P < 0.0005, t = 4.2, t-test; five litters per group. One B1 mouse was excluded because it scored more than three s.d.s above the group mean (c) Clock maze task. (Left) the graph shows the latency to escape from the center of the maze to a peripherally located exit. C6-exposed male mice (n = 6) perform similarly to B1-exposed male mice (n = 11) in the initial phase (Exit flexibility ratio (defined in Methods) shows that C6-exposed mice are significantly less likely to switch from a familiar exit to a novel one, showing impaired flexible learning; P < 0.02, Z = 2.36, Mann-Whitney test; 2–3 litters per group.

References

    1. Diagnostic and Statistical Manual of Mental Disorders. 5th. American Psychiatric Publishing; Arlington, VA, USA: 2013.
    1. Developmental Disabilities Monitoring Network Surveillance Year 2010 Principal Investigators; Centers for Disease Control and Prevention (CDC) Prevalence of autism spectrum disorder among children aged 8 years – autism and developmental disabilities monitoring network, 11 sites, United States, 2010. MMWR Surveill Summ. 2014;63:1–21. - PubMed
    1. Risch N, Hoffmann TJ, Anderson M, Croen LA, Grether JK, Windham GC. Familial recurrence of autism spectrum disorder: evaluating genetic and environmental contributions. Am J Psychiatry. 2014;171:1206–1213. - PubMed
    1. Patterson PH. Maternal infection and autism. Brain Behav Immun. 2012;26:393. - PubMed
    1. Smith SE, Li J, Garbett K, Mirnics K, Patterson PH. Maternal immune activation alters fetal brain development through interleukin-6. J Neurosci. 2007;27:10695–10702. - PMC - PubMed

Publication types

MeSH terms