. 2016 Oct 4:7:12986.
doi: 10.1038/ncomms12986.

Massive yet grossly underestimated global costs of invasive insects

Affiliations

Massive yet grossly underestimated global costs of invasive insects

Corey J A Bradshaw et al. Nat Commun. .

Abstract

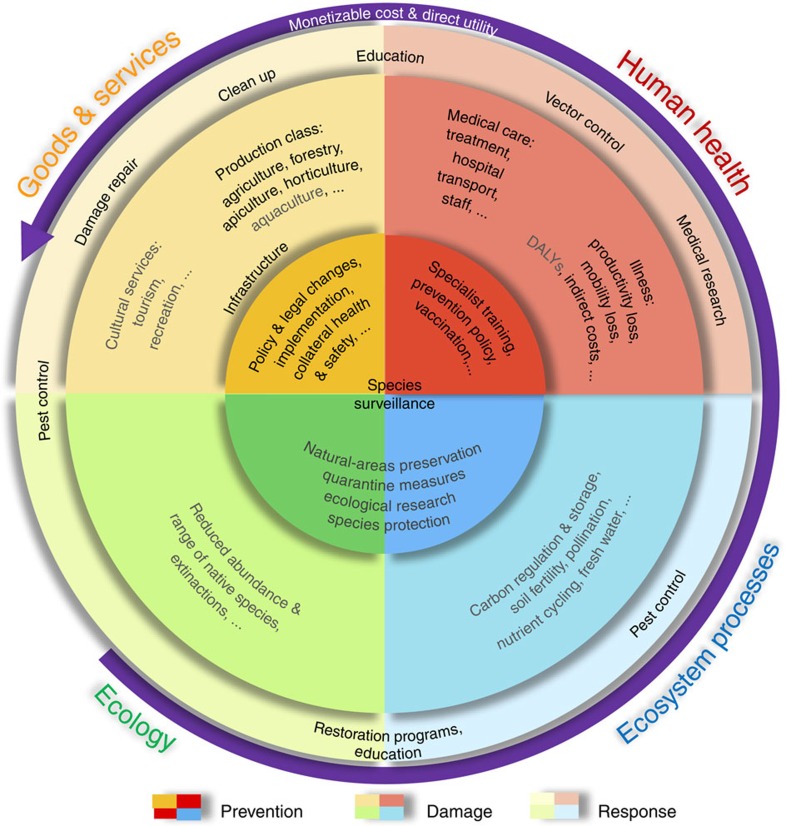
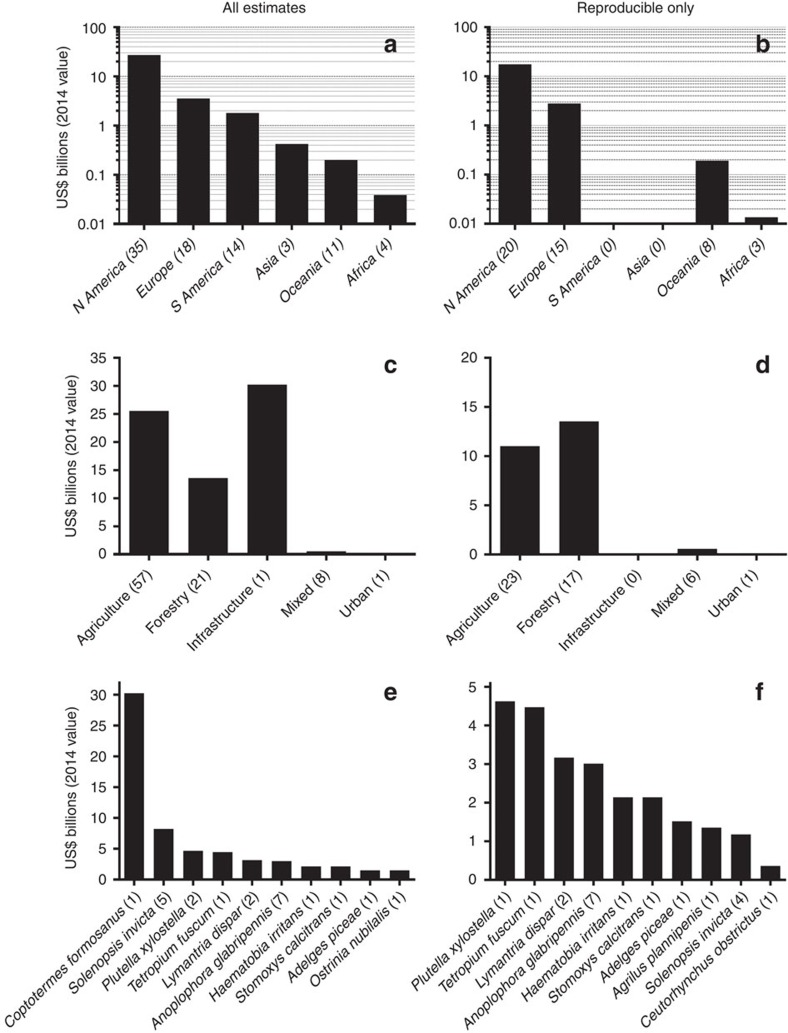
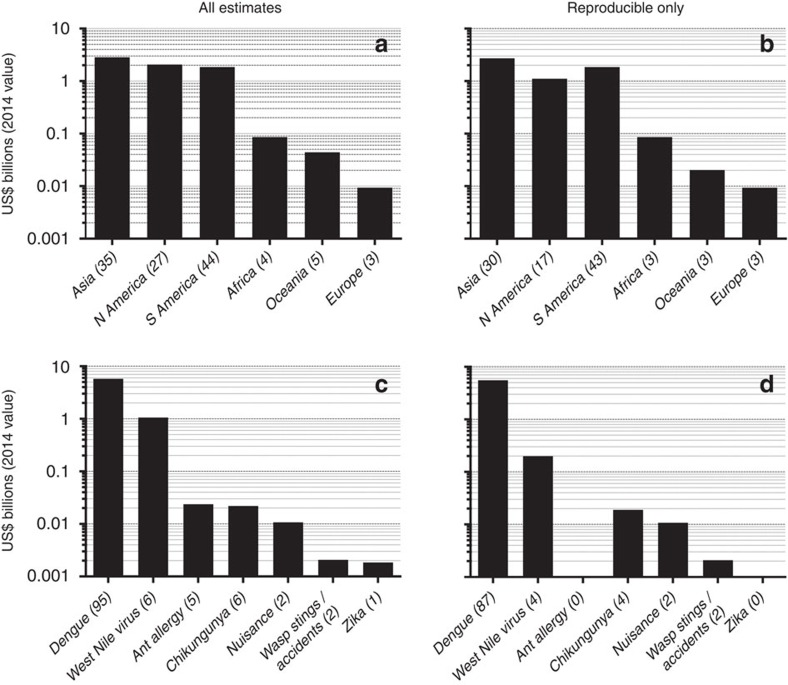
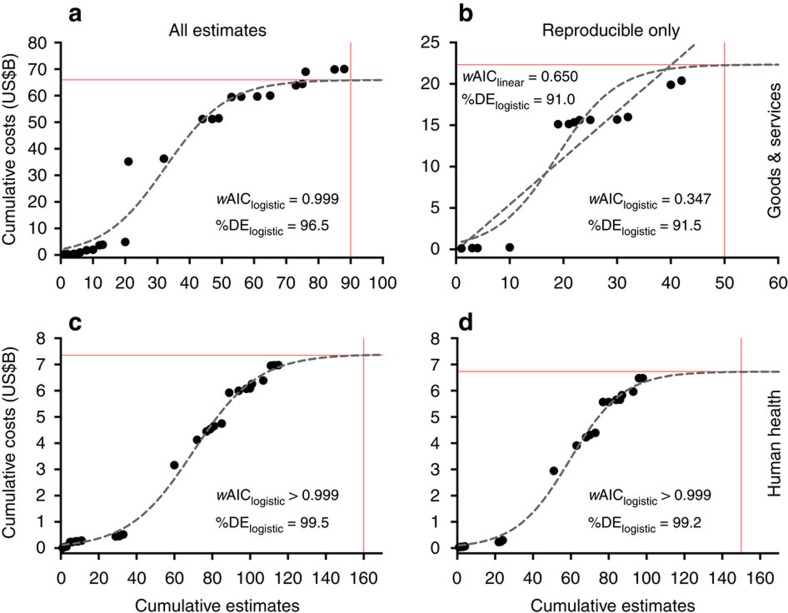
Insects have presented human society with some of its greatest development challenges by spreading diseases, consuming crops and damaging infrastructure. Despite the massive human and financial toll of invasive insects, cost estimates of their impacts remain sporadic, spatially incomplete and of questionable quality. Here we compile a comprehensive database of economic costs of invasive insects. Taking all reported goods and service estimates, invasive insects cost a minimum of US$70.0 billion per year globally, while associated health costs exceed US$6.9 billion per year. Total costs rise as the number of estimate increases, although many of the worst costs have already been estimated (especially those related to human health). A lack of dedicated studies, especially for reproducible goods and service estimates, implies gross underestimation of global costs. Global warming as a consequence of climate change, rising human population densities and intensifying international trade will allow these costly insects to spread into new areas, but substantial savings could be achieved by increasing surveillance, containment and public awareness.


Figures

Figure 1
Figure 1. Market and non-market cost categories associated with invasive insect damages.
Costs are subdivided into ‘goods and services' (yellow) and ‘human health' (red), ‘regulating services' (sensu non-commercial, but potentially monetizable, such as carbon regulation and pollination not otherwise quantified in agricultural yield estimates; blue) and ‘ecological' costs (not typically monetizable; green). Owing mainly to a lack of monetary estimates, we could not compile costs for the categories and subcategories coloured in grey. The inner circle (darkest colours) encapsulates costs associated with prevention; the middle circle (mid-range colours) includes costs associated with damage from invasive insects; the outer circle (lightest colours) covers costs associated with responses or follow-up to invasive insect incursions. The outermost purple arrow indicates the general increase in our ability to estimate monetizable costs, and the direct relevance to human commerce and well being. DALY, disability-adjusted life year (lifespan lost because of burden of insect-borne disease; not assessed).
Figure 2
Figure 2. Goods and services costs associated with invasive insects.
Direct goods and services costs are categorized by major region (a,b), type (c,d) and by the 10 costliest insects (e,f). The first column includes all estimates regardless of reproducibility (a,c,e), whereas the second only includes costs for which estimates can be verified (‘reproducible'; b,d,f). All costs expressed as annual 2014 US dollars. Bracketed numbers in the x axis labels indicate the number of estimates per category.
Figure 3
Figure 3. Human health costs associated with invasive insects.
Direct human health costs are categorized by major region (a,b) and disease (c,d). The first column includes all estimates regardless of reproducibility (a,c), whereas the second only includes costs for which estimates can be verified (‘reproducible'; b,d). All costs expressed as annual 2014 US dollars. Bracketed numbers in the x axis labels indicate the number of estimates per category.
Figure 4
Figure 4. Global cumulative costs due to invasive insects.
Costs are expressed relative to the number of estimates for goods and services (a,b) and human health-related (c,d) costs, and for all estimates (a,c) and reproducible-only estimates (b,d). For a given year t, we summed all values (costs and number of estimates) up to t (see ‘Sampling bias' in the Supplementary Methods for model fitting and comparison methods). We fitted linear, exponential, logarithmic and logistic models to each curve to examine evidence for asymptotic behaviour (identified by the dominance of a logarithmic or logistic model). For all categories except reproducible-only goods and services costs (b), the logistic model (curvilinear grey dashed lines) had the highest Akaike's information criterion (AIC) weights (wAIC≈relative model probability) and explained >96% of the deviance in the data (%DE≈coefficient of determination). For reproducible-only goods and services costs (b), the linear model (straight grey dashed line) had the highest wAIC, indicating that the logistic asymptote was likely an underestimate. For each fit, we also show the approximate asymptotic cost and the associated number of cumulative estimates required to achieve the asymptote (red lines). See also Supplementary Figs 7 and 8 for accumulation curves expressed by region. All costs expressed as 2014 US dollars.

References

    1. World Health Organization. World Malaria Report 2015 World Health Organization (2015).
    1. Mellor P. S., Boorman J. & Baylis M. Culicoides biting midges: their role as arbovirus vectors. Annu. Rev. Entomol. 45, 307–340 (2000). - PubMed
    1. Oerke E.-C. Crop losses to pests. J. Agric. Sci. 144, 31–43 (2006).
    1. Aukema J. E. et al.. Historical accumulation of nonindigenous forest pests in the continental United States. BioScience 60, 886–897 (2010).
    1. Su N. Y. Novel technologies for subterranean termite control. Sociobiology 39, 95–101 (2002).

Publication types

LinkOut - more resources