. 2016 Oct 4:6:34449.
doi: 10.1038/srep34449.

Deciphering KRAS and NRAS mutated clone dynamics in MLL-AF4 paediatric leukaemia by ultra deep sequencing analysis

Affiliations

Deciphering KRAS and NRAS mutated clone dynamics in MLL-AF4 paediatric leukaemia by ultra deep sequencing analysis

Luca Trentin et al. Sci Rep. .

Abstract

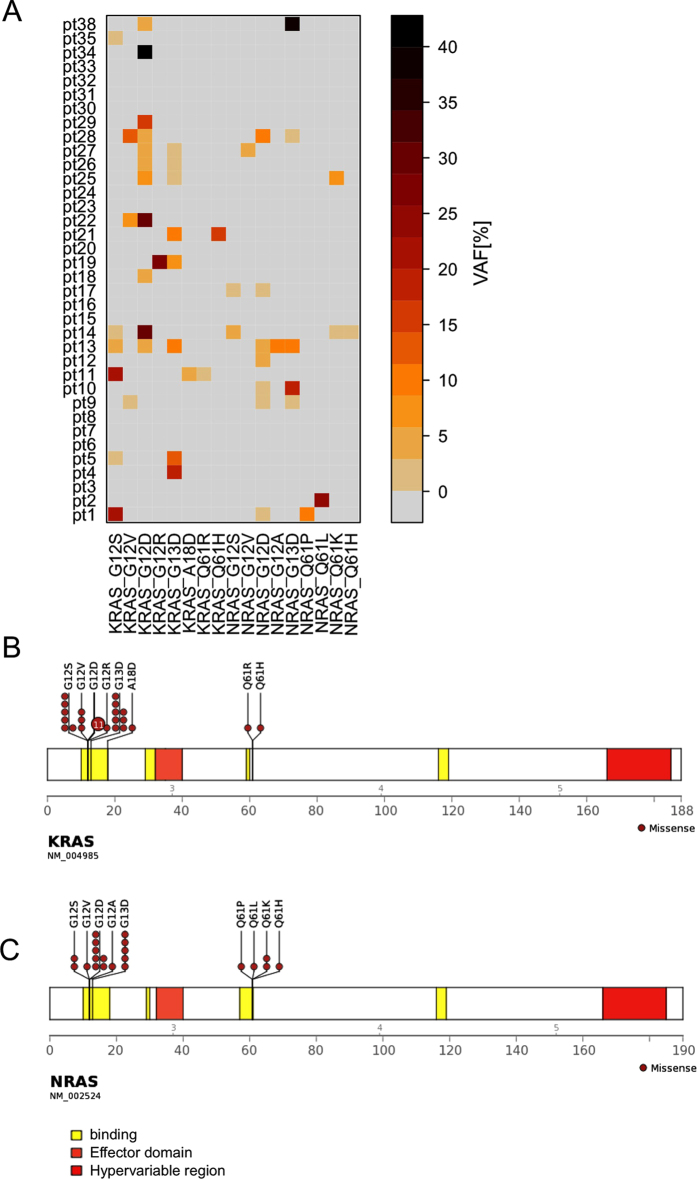
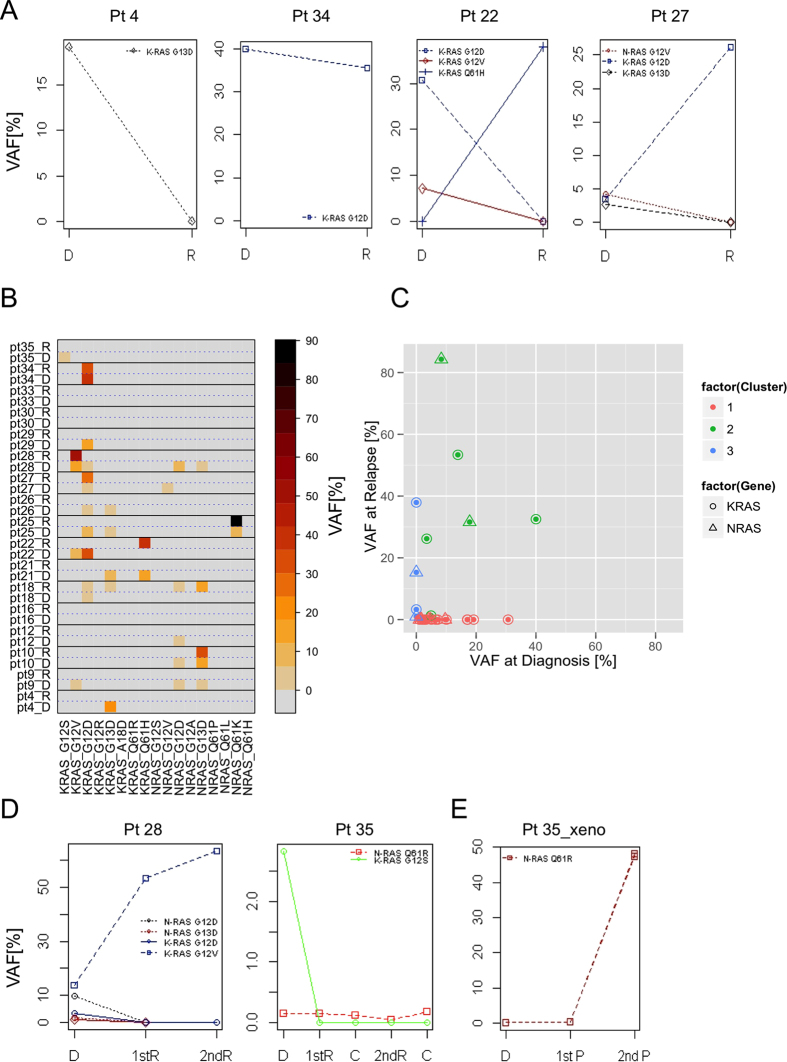
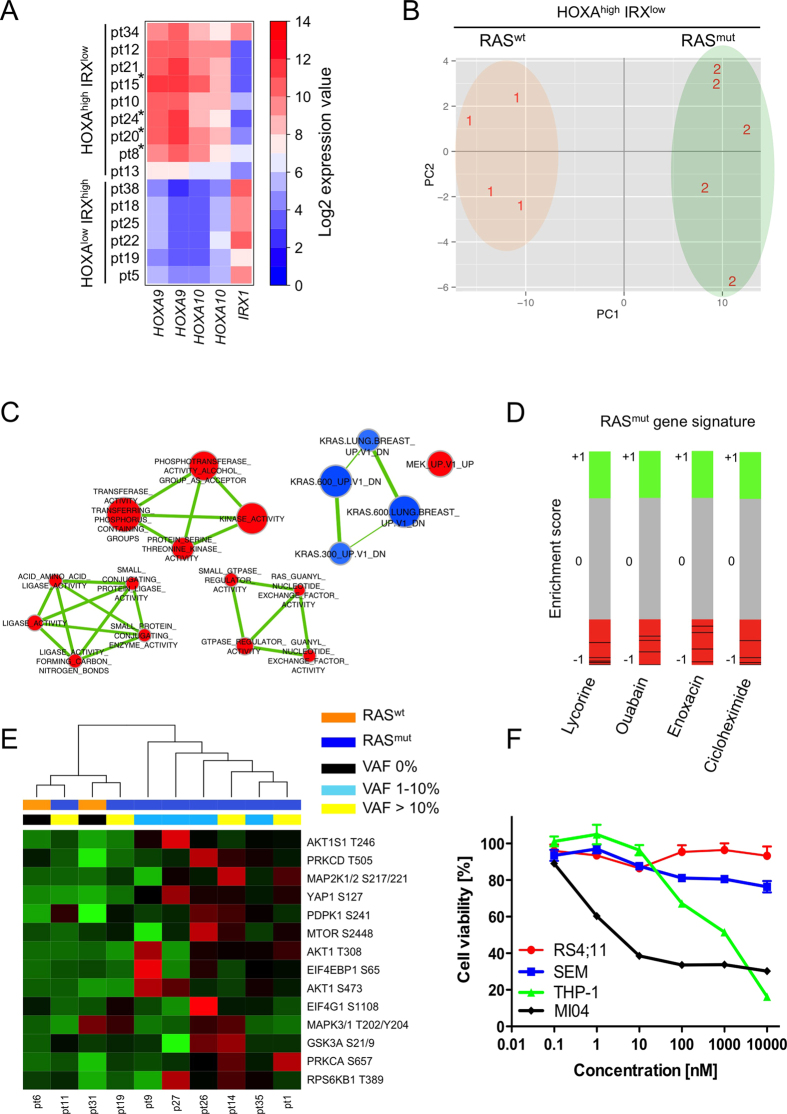
To induce and sustain the leukaemogenic process, MLL-AF4+ leukaemia seems to require very few genetic alterations in addition to the fusion gene itself. Studies of infant and paediatric patients with MLL-AF4+ B cell precursor acute lymphoblastic leukaemia (BCP-ALL) have reported mutations in KRAS and NRAS with incidences ranging from 25 to 50%. Whereas previous studies employed Sanger sequencing, here we used next generation amplicon deep sequencing for in depth evaluation of RAS mutations in 36 paediatric patients at diagnosis of MLL-AF4+ leukaemia. RAS mutations including those in small sub-clones were detected in 63.9% of patients. Furthermore, the mutational analysis of 17 paired samples at diagnosis and relapse revealed complex RAS clone dynamics and showed that the mutated clones present at relapse were almost all originated from clones that were already detectable at diagnosis and survived to the initial therapy. Finally, we showed that mutated patients were indeed characterized by a RAS related signature at both transcriptional and protein levels and that the targeting of the RAS pathway could be of beneficial for treatment of MLL-AF4+ BCP-ALL clones carrying somatic RAS mutations.


Figures

Figure 1
Figure 1. RAS mutational profiles of infant and non-infant MLL-AF4 positive patients.
(A) Distributions of KRAS and NRAS mutations in the 36 analysed patients at diagnosis according to ultra deep sequencing analysis. The variant allele frequency (VAF) is reported as percentage using a colour code scale. (B) Schematic diagrams of all the identified mutations in KRAS and NRAS with VAF >1% with respect to proteins functional domains.
Figure 2
Figure 2. RAS clones dynamics over time.
(A) Plots exemplifying the four different behaviours of the mutated clones identified in paired samples at diagnosis (D) and relapse (R). (B) Distributions of KRAS and NRAS mutations in the 17 analysed patients at diagnosis (D) and relapse (R) according to ultra deep sequencing analysis. The variant allele frequency (VAF) is reported as percentage using a colour code scale. Straight lines separate individual patients and dotted lines divide data measured at diagnosis and relapse. (C) The variant allele frequency (VAF) of mutated clones is reported as percentage in matched samples at diagnosis and relapse allowing the identification of three major clusters. Cluster 1: mutations present at diagnosis only; cluster 2: mutations with a constant and/or increasing VAF over time; cluster 3: de novo mutations at relapse. Circle: KRAS mutation; triangle: NRAS mutation. (D) RAS mutated clones in first relapse (1st R), second (2nd R) relapse and in available control time points (C) in patient (Pt) 28 and patient (Pt) 35. (E) Detection of RAS mutated clones in DNA isolated from bone marrow cells of xenotransplanted NOD/SCID mice (N = 2) using patient 35 BM cells at diagnosis. 1st P: primary passage; 2nd P: secondary passage.
Figure 3
Figure 3. Detection of a RAS related signature in RASmut patients.
(A) HOXA9 (209905_at and 214651_s_at), HOXA10 (213150_at and 213147_at) and IRX1 (230472_at) expression levels in 15 MLL-AF4 positive patients at diagnosis. *: RAS wild type (RASwt) patients. (B) Principal component analysis (PCA) of HOXAhighIRXlow/RASmut and HOXAhighIRXlow/RASwt patients. The samples were projected into a 2-dimensional space (PC1 and PC2) consisting of the differentially expressed genes (FDR q-val < 0.05) between HOXAhighIRXlow/RASmut (N = 5; label: 2) and HOXAhighIRXlow/RASwt (N = 4; label: 1) patients. Samples with similar characteristics will cluster together. (C) Enrichment map visualization of significant (FDR q-val < 0.05) enriched gene sets comparing HOXAhighIRXlow/RASmut and HOXAhighIRXlow/RASwt patients. Gene sets are depicted as circles (nodes) with edges indicating overlap between nodes. Node size is proportional to gene set size and the edges thickness shows the degree of overlap among the nodes. Red and blue colours indicate positive and negative enrichment in HOXAhighIRXlow/RASmut samples, respectively. (D) Bar-views according to connectivity map analysis. Each black line represents an individual treatment instance ordered according to its corresponding connectivity score (+1 and −1) with respect to the query signature based on genes differentially expressed between HOXAhighIRXlow/RASmut and HOXAhighIRXlow/RASwt patients with FDR q-val < 0.1. Instances at the bottom (connectivity score: −1) are more strongly anti-correlated with the query signature indicating the possibility to revert the RASmut phenotype. (E) The hierarchical clustering analysis of RASmut (N = 8) and RASwt (N = 2) patients samples according to proteins levels measured by RPPA reveals two clusters. One cluster contains all but 2 RASmut patients and the second one contains the 2 RASwt and the remaining 2 RASmut patients. Rows represent each analysed protein and columns represent patients. The red and green colours reflect high and low expression level, respectively. (F) MTT cell viability assay in the MLL-AF4+ RASmut cell line MI04 and in two RASwt MLL-AF4+ cell lines (i.e. RS4; 11 and SEM) treated for 72 h with increasing concentration of PD0325901. The myeloid cell line THP-1 with the NRAS G12D and the MLL-AF9 fusion gene was use as positive control. Data represent mean values ± s.d. of three independent experiments.

Similar articles

Cited by

References

    1. Pui C. H. et al. Clinical heterogeneity in childhood acute lymphoblastic leukemia with 11q23 rearrangements. Leukemia 17, 700–706 (2003). - PubMed
    1. Mann G. et al. Improved outcome with hematopoietic stem cell transplantation in a poor prognostic subgroup of infants with mixed-lineage-leukemia (MLL)-rearranged acute lymphoblastic leukemia: results from the Interfant-99 Study. Blood 116, 2644–2650 (2010). - PubMed
    1. Sanjuan-Pla A. et al. Revisiting the biology of infant t(4;11)/MLL-AF4+ B-cell acute lymphoblastic leukemia. Blood (2015). - PMC - PubMed
    1. Ayton P. M. & Cleary M. L. Molecular mechanisms of leukemogenesis mediated by MLL fusion proteins. Oncogene 20, 5695–5707 (2001). - PubMed
    1. Krivtsov A. V. & Armstrong S. A. MLL translocations, histone modifications and leukaemia stem-cell development. Nat. Rev. Cancer. 7, 823–833 (2007). - PubMed

Publication types