. 2016 Oct 4:6:34548.
doi: 10.1038/srep34548.

Na+ compartmentalization related to salinity stress tolerance in upland cotton (Gossypium hirsutum) seedlings

Affiliations

Na+ compartmentalization related to salinity stress tolerance in upland cotton (Gossypium hirsutum) seedlings

Zhen Peng et al. Sci Rep. .

Abstract

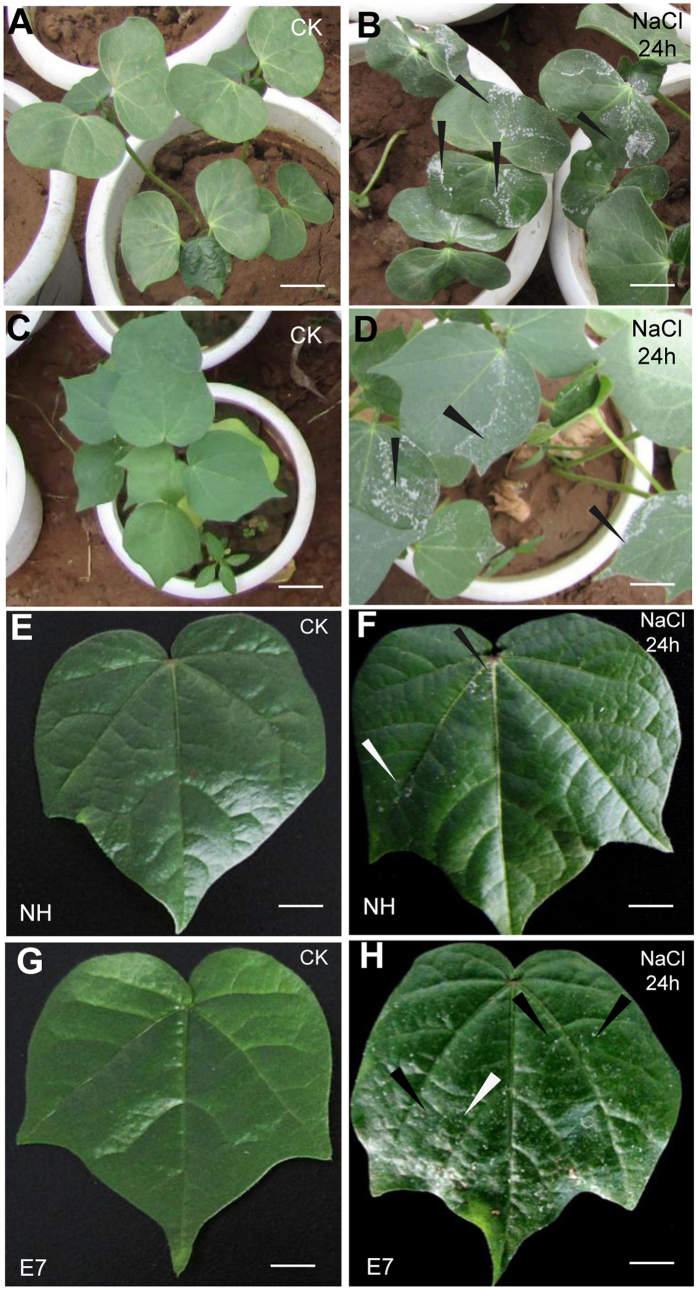
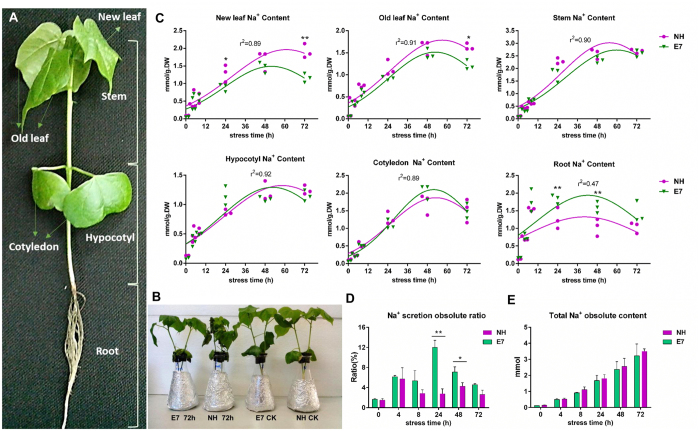
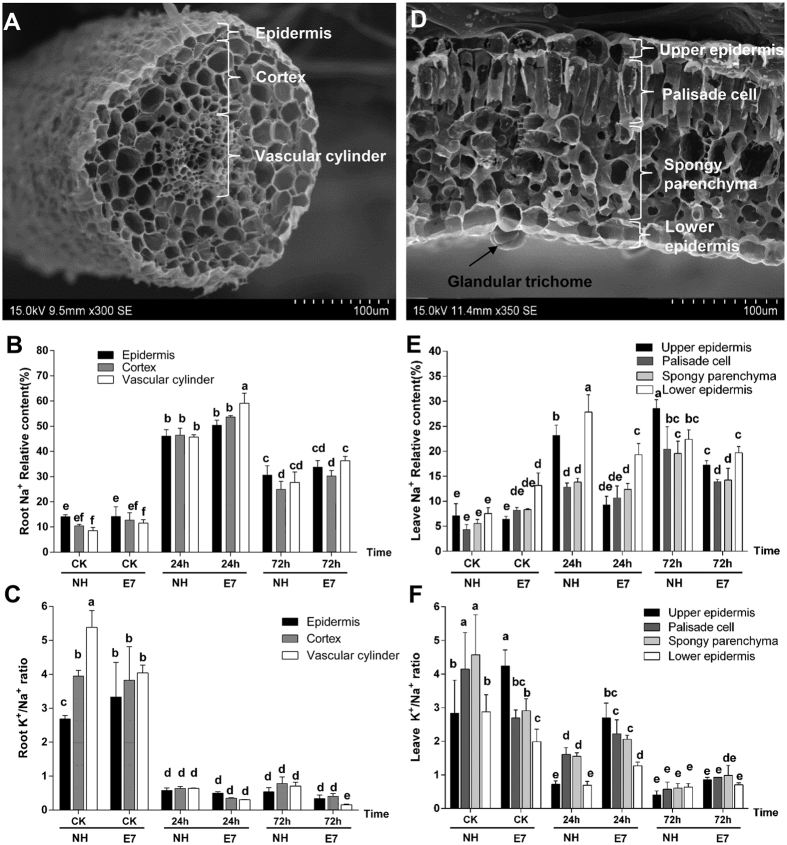
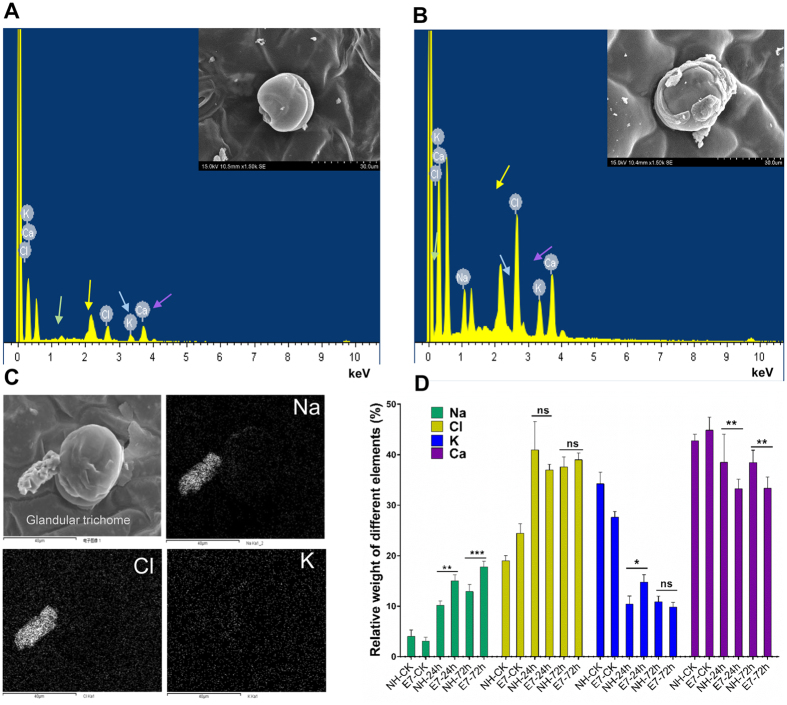
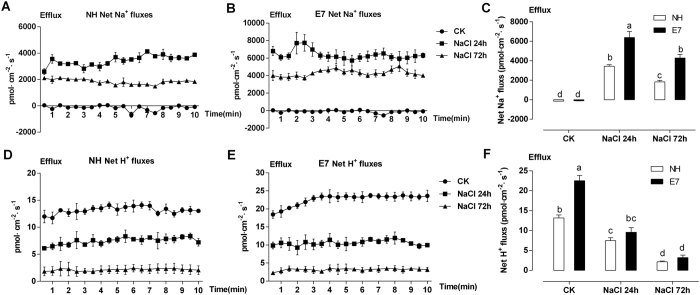
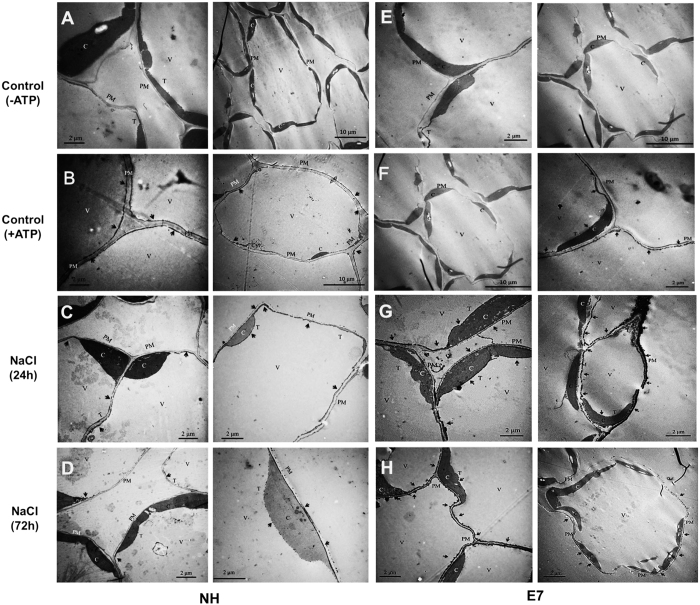
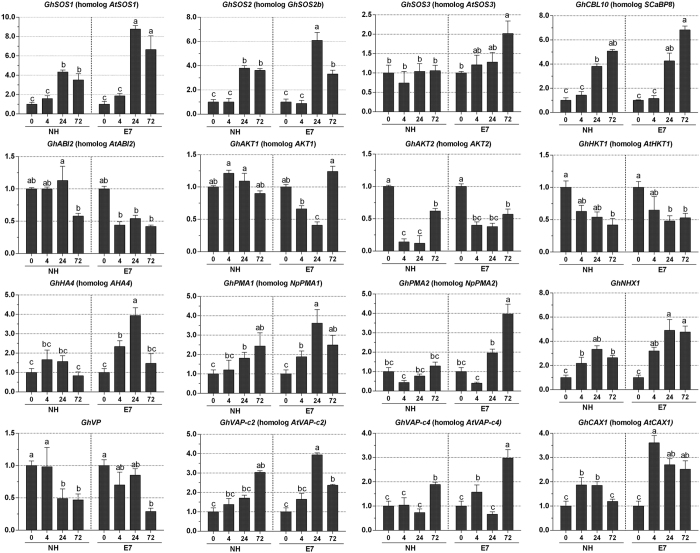
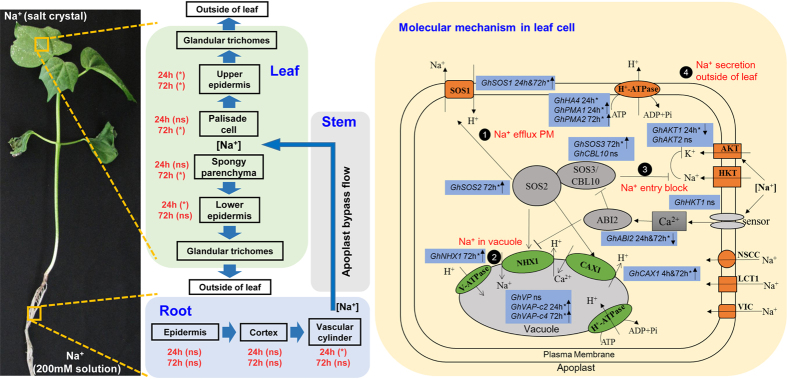
The capacity for ion compartmentalization among different tissues and cells is the key mechanism regulating salt tolerance in plants. In this study, we investigated the ion compartmentalization capacity of two upland cotton genotypes with different salt tolerances under salt shock at the tissue, cell and molecular levels. We found that the leaf glandular trichome could secrete more salt ions in the salt-tolerant genotype than in the sensitive genotype, demonstrating the excretion of ions from tissue may be a new mechanism to respond to short-term salt shock. Furthermore, an investigation of the ion distribution demonstrated that the ion content was significantly lower in critical tissues and cells of the salt-tolerant genotype, indicating the salt-tolerant genotype had a greater capacity for ion compartmentalization in the shoot. By comparing the membrane H+-ATPase activity and the expression of ion transportation-related genes, we found that the H+-ATPase activity and Na+/H+ antiporter are the key factors determining the capacity for ion compartmentalization in leaves, which might further determine the salt tolerance of cotton. The novel function of the glandular trichome and the comparison of Na+ compartmentalization between two cotton genotypes with contrasting salt tolerances provide a new understanding of the salt tolerance mechanism in cotton.


Figures

Figure 1
Figure 1. Visual appearance of upland cotton seedlings after salt shock.
Abundant salt crystals observed on the adaxial leaf surface of the E7 genotype at the cotyledon stage (A,B) and the seeding stage (C,D) after treatment with 4% NaCl solution for 24 h. (E–H) Salt crystals observed on the NH and E7 adaxial leaf surfaces after 24 h with and without 200 mM NaCl treatment in Hoagland’s solution. Bars = 0.5 cm (E–H), 1 cm (B,D), and 2 cm (A,C). Arrows indicate salt crystals.
Figure 2
Figure 2. Na+ content in the NH and E7 genotypes after NaCl shock at different time points and in different tissues.
(A) Cotton seedlings were divided into 6 different tissue types and used to measure the relative content of Na+ and K+. (B) Visual appearance of NH and E7 seedlings after 72 h with and without 200 mM NaCl treatment. (C) Accumulation of Na+ in six NH and E7 tissue types with 200 mM NaCl shock over 72 h. Each symbol represents one biological repeat. (D) The percentage of Na+ secreted as a proportion of the total Na+ content in the whole plant between the two genotypes. The results are the means ± standard errors of three biological replicates. (E) The total Na+ content in the whole plant between the two genotypes. Single (*) and double (**) asterisks indicate significant differences (P < 0.05, one-way ANOVA).
Figure 3
Figure 3. Na+ content in NH and E7 after NaCl shock at different time points and in different cells of the roots and leaves.
Scanning electron micrographs of the three root cell types with a map scan from the X-ray microanalysis (A). The percentages of Na+ (B) and the K+/Na+ ratios (C) in the epidermis, cortex, and vascular cylinder sections of the roots of G. hirsutum seedlings exposed to 200 mM NaCl for 72 h. (D) Scanning electron micrographs of the four leaf cell types with a map scan from the X-ray microanalysis. The percentages of Na+ (E) and the K+/Na+ ratios (F) in the upper epidermis, palisade cell, spongy parenchyma, and lower epidermis sections of leaves of G. hirsutum seedlings exposed to 200 mM NaCl for 72 h. The data are the means of 5–8 measurements. The same letter on the bar diagram represents no significant difference (P = 0.05), as determined by the one-way ANOVA. X-ray microanalysis was used to detect the ratios of elements in the roots and leaves. The results were expressed as the percentages of the atomic numbers for particular elements (Na+ or K+) in the total atomic number for all of the elements (Na+, K+, Ca2+, and Cl) measured in a given region.
Figure 4
Figure 4. Glandular trichomes respond to NaCl shock.
Energy-dispersive X-ray spectroscopy (A: ck; B: 24 h) and map (C: 72 h) showing secreted salt crystals (*) on GTs (C) consisting mainly of Na and Cl. Identical highlighted sites on the Na and Cl maps indicate that the two elements coincide with the salt crystals found on the adaxial leaf surface. (D) Higher Na, Cl, K, and Ca contents in the secretions around the GTs were detected with greater NaCl shock. The results are the means ± standard errors of five biological replicates. *P < 0.05; **P < 0.01; ***P < 0.001; ns indicates no significant difference in the four elements between NH and E7 genotypes at different time points.
Figure 5
Figure 5. Net Na+ and H+ fluxes in mesophyll cells of the second true leaves.
NH (A,D) and E7 (B,E) fluxes under 0 and 200 mM NaCl shock for 24 and 72 h. The Na+ and H+ fluxes were measured immediately after the mesophyll cells were sampled. Each point is the mean of 4–6 individual plants. The bars represent the standard errors of the mean. Panels C and F show the mean flux rates of Na+ and H+ from 0 to 10 min after the onset of salt shock, which lasted for 24 and 72 h, respectively. Columns labelled with different letters indicate significant differences at P < 0.05.
Figure 6
Figure 6. Cytochemical analysis of the H+-ATPase activity in leaf cells of E7 (salt tolerant) and NH (salt sensitive) cotton.
The staining intensity of the black spot represents the hydrolysis activity of H+-ATPase. Blank control (A,E) (ATP was absent from the reaction solution); Control (B,F); 200 mM NaCl (24 h) (C,G); 200 mM NaCl (72 h) (D,H). V, vacuole; N, nucleus; C, chloroplast; T, tonoplast; PM, plasma membrane; Cyt, cytosol. Arrows indicate the reaction product of Pb3(PO4)2 precipitates.
Figure 7
Figure 7. Expression patterns of genes related to salt tolerance in cotton.
Gene expression of NH and E7 leaves was compared by qRT-PCR after 0, 4, 24 and 72 h of treatment with NaCl shock. The error bars indicate standard deviations from nine repeats (three biological × three technical repeats). Selected genes encoding pH regulators (PM- and V-ATPase), SOS pathway-related proteins (SOS1, SOS2, SOS3, and ABI2), K+ transporters (HKT1 and AKT1), and membrane trafficking-related proteins (NHX1) are shown. capital letters indicate significant differences at the 0.05 level.
Figure 8
Figure 8. Distribution and transportation of Na+ in G. hirsutum.
Schematic diagram presenting the Na+ distribution and transportation in cotton at the tissue and cellular levels from the soil through the roots and up to the shoots. The molecular mechanism of intracellular Na+ compartmentalization is also presented. For roots and leaves, *indicates that the Na+ content was significantly different between the two species at various time points. Regarding the molecular mechanisms in leaf cells, (1) Na+ was extruded or effluxed from the cytosol of photosynthetic cells by PM H+-ATPase and SOS1. (2) Na+ was efficiently sequestered into vacuoles; this step was possibly mediated by a tonoplast proton pump and NHX antiporters. (3) The influxed Na+ in leaf cells was blocked by the HKT1 transporter. (4) Na+ was secreted from the leaves by glandular trichomes. Blue boxes represent Na+ transportation-related genes between NH and E7 after 24 and/or 72 h; *indicates significantly different expression; ns indicates not significant; upward-pointing arrows indicate genes that were up-regulated in the salt-tolerant genotype; downward-pointing arrows indicate genes that were down-regulated.

References

    1. Zhu J. K. Plant salt tolerance. Trends in plant science 6, 66–71 (2001). - PubMed
    1. Food and Agriculture Organisation (FAO), FAO land and plant nutrition management service http://www.fao.org/ag/agl/apgll/spush (Date of access: 29/October 29/2010) (2010).
    1. Li J. G. et al. Soil salinization research in China, Advances and prospects. Journal of Geographical Sciences 24, 943–960 (2014).
    1. Wang J. et al. Review on sustainable utilization of salt-affected land. Acta Geographica Sinica 66, 673–684 (2011).
    1. Zhu J. K. Regulation of ion homeostasis under salt stress. Current Opinion in Plant Biology 6, 441–445 (2003). - PubMed

Publication types