Comparative Study
. 2016 Oct 4:7:12767.
doi: 10.1038/ncomms12767.

Comparative and parallel genome-wide association studies for metabolic and agronomic traits in cereals

Affiliations
Comparative Study

Comparative and parallel genome-wide association studies for metabolic and agronomic traits in cereals

Wei Chen et al. Nat Commun. .

Abstract

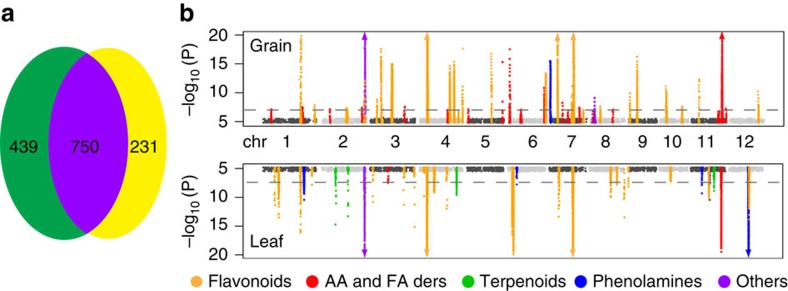
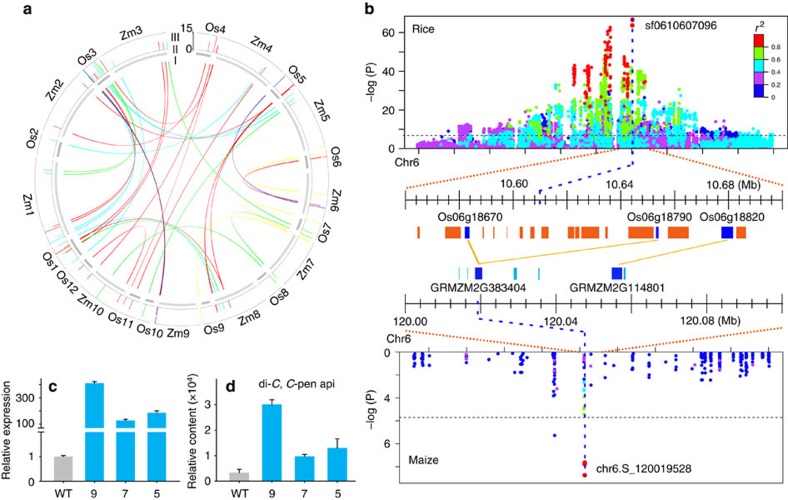
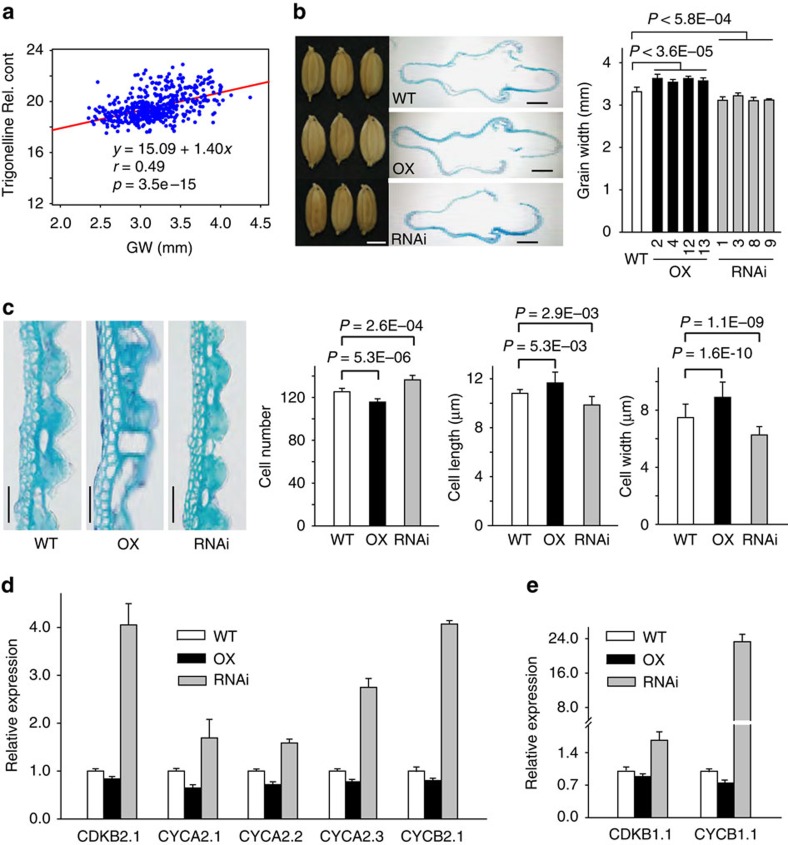
The plant metabolome is characterized by extensive diversity and is often regarded as a bridge between genome and phenome. Here we report metabolic and phenotypic genome-wide studies (mGWAS and pGWAS) in rice grain that, in addition to previous metabolic GWAS in rice leaf and maize kernel, show both distinct and overlapping aspects of genetic control of metabolism within and between species. We identify new candidate genes potentially influencing important metabolic and/or morphological traits. We show that the differential genetic architecture of rice metabolism between different tissues is in part determined by tissue specific expression. Using parallel mGWAS and pGWAS we identify new candidate genes potentially responsible for variation in traits such as grain colour and size, and provide evidence of metabotype-phenotype linkage. Our study demonstrates a powerful strategy for interactive functional genomics and metabolomics in plants, especially the cloning of minor QTLs for complex phenotypic traits.


Figures

Figure 1
Figure 1. Comparison of the genetic bases of metabolism between rice grains and leaves.
(a) Comparison of metabolic features in rice grains and leaves. (b) Manhattan plots of mGWAS results with genetic association in different tissues for the same metabolic features in rice. The strength of association for the grain (top) and leaf (bottom) metabolic features is indicated as the negative logarithm of the P value for the LMM model. All metabolite-SNP associations with P values below 6.6E-08 (horizontal dashed lines in all Manhattan plots) are plotted against the genome location in intervals of 1 Mb. Triangles: metabolite-SNP associations with P values below 1.0E-20. AA and NA ders: amino acid and nucleic acid derivatives, respectively.
Figure 2
Figure 2. Interactive metabolite and gene identification.
(a) Sub-network of GGM results. Blue circles: amino acid derivatives. Grey triangles: previously unknown metabolites are newly identified by GGM. The fragmentation pattern (b) and retention time (c) of N-benzoyltryptamine, N-cinnamoyltryptamine and N-benzoylserotonin, obtained by in vitro enzyme reactions catalysed by Os11g42370.
Figure 3
Figure 3. Comparative mGWAS between rice and maize.
(a) The global view and relationships of comparative mGWAS results between rice and maize. I: oriented homologous loci between rice and maize. Links in colour represent homologous loci of different types of metabolites between rice and maize. Red: flavonoid; blue: nucleic acid; green: alkaloid, amino acid and fatty acid; yellow: polyamine and polyphenol; cyan: others and unknown. II: schematic diagram of chromosomes of rice and maize. The scale of chromosomes in maize is half of that in rice. III: bar plot of loci with candidate genes in rice and maize according to their −Log10(P) value. (b) Co-linear genomic regions and homologous loci (or genes) of di-C, C-pentosyl-apigenin between rice grains and maize kernels. Os06g18670 and Os06g18790 are homologous (or orthologous) to GRMZM2G383404. Os06g18820 is homologous to GRMZM2G114801. Bar plots for the messenger RNA level of Os06g18670 (c) and the content of di-C, C-pentosyl-apigenin (d) in transgenic individuals. WT: the transgenic background variety ZH11. The P value is calculated using the Student's t tests. Data are shown as the means±s.e.m., n=3.
Figure 4
Figure 4. Evidence of metabotype-phenotype linkage.
(a) Correlation between grain width (GW) and trigonelline content in 489 rice varieties. (b) Comparison of spikelet hull. Left: spikelet (scale bar, 3 mm). Middle: cross-section of spikelet hull (scale bar, 500 μm). Right: comparison of grain width. (c) Magnified view of spikelet hull cross-section from the box in b. Scale bar, 50 μm. Comparison of cell number, mean cell length and width in the outer parenchymal cell layers of spikelet hulls of WT, over-expression (OX) and RNA interference lines, respectively. (d) Transcript levels of genes associated with cell cycle regulation. (e) Transcript levels of genes involved in mitosis. The r value is based on the Pearson correlation coefficient. The P value is calculated using the Student's t tests. WT: the transgenic background variety ZH11. Data are shown as the means±s.e.m., n=3.

References

    1. Keurentjes J. J. Genetical metabolomics: closing in on phenotypes. Curr. Opin. Plant Biol. 12, 223–230 (2009). - PubMed
    1. Keurentjes J. J. et al.. Integrative analyses of genetic variation in enzyme activities of primary carbohydrate metabolism reveal distinct modes of regulation in Arabidopsis thaliana. Genome Biol. 9, R129 (2008). - PMC - PubMed
    1. Saito K. & Matsuda F. Metabolomics for functional genomics, systems biology, and biotechnology. Annu. Rev. Plant Biol. 61, 463–489 (2010). - PubMed
    1. Fiehn O. et al.. Metabolite profiling for plant functional genomics. Nat. Biotechnol. 18, 1157–1161 (2000). - PubMed
    1. Keurentjes J. J. et al.. The genetics of plant metabolism. Nat. Genet. 38, 842–849 (2006). - PubMed

Publication types

MeSH terms

LinkOut - more resources