. 2016:2016:9275106.
doi: 10.1155/2016/9275106. Epub 2016 Sep 6.

Insights from lncRNAs Profiling of MIN6 Beta Cells Undergoing Inflammation

Affiliations

Insights from lncRNAs Profiling of MIN6 Beta Cells Undergoing Inflammation

Chuntao Sun et al. Mediators Inflamm. 2016.

Abstract

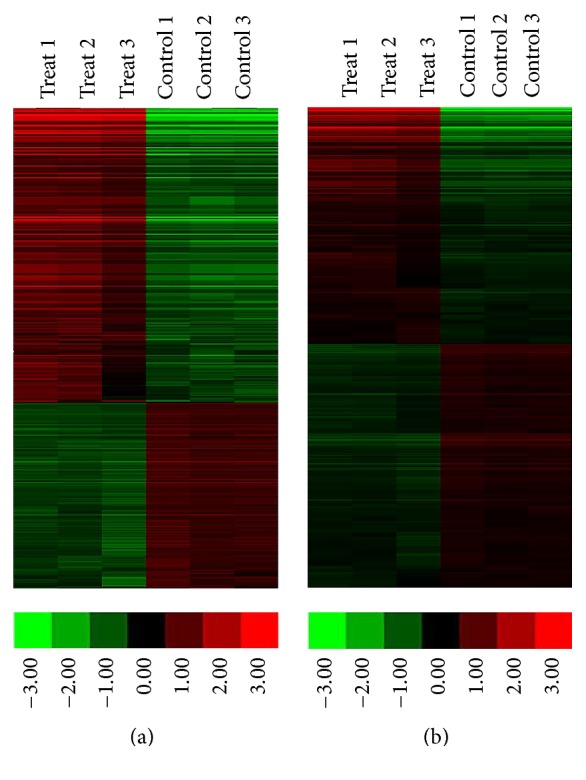
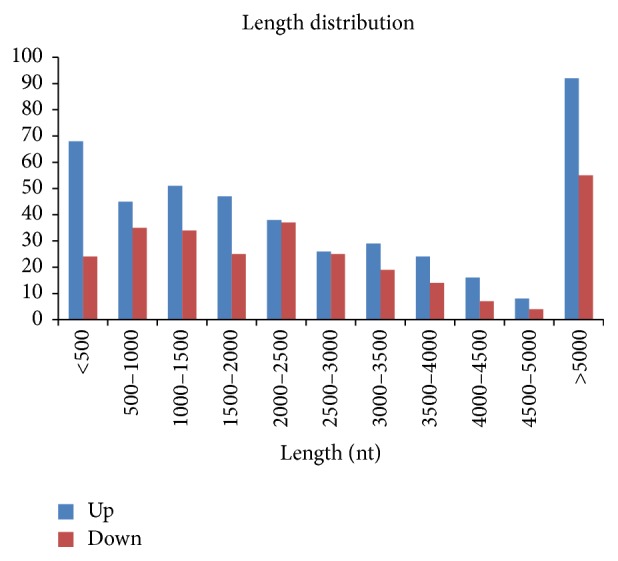
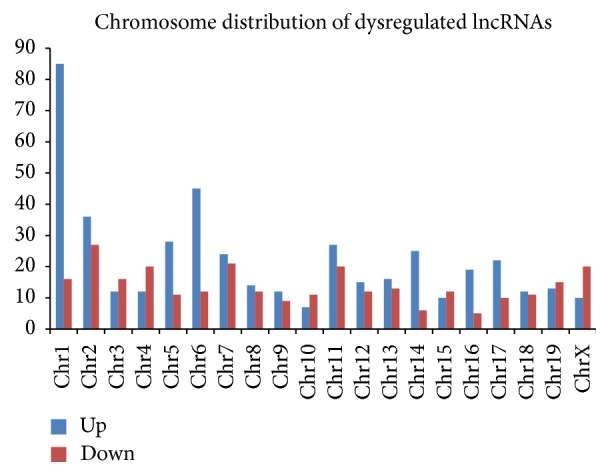
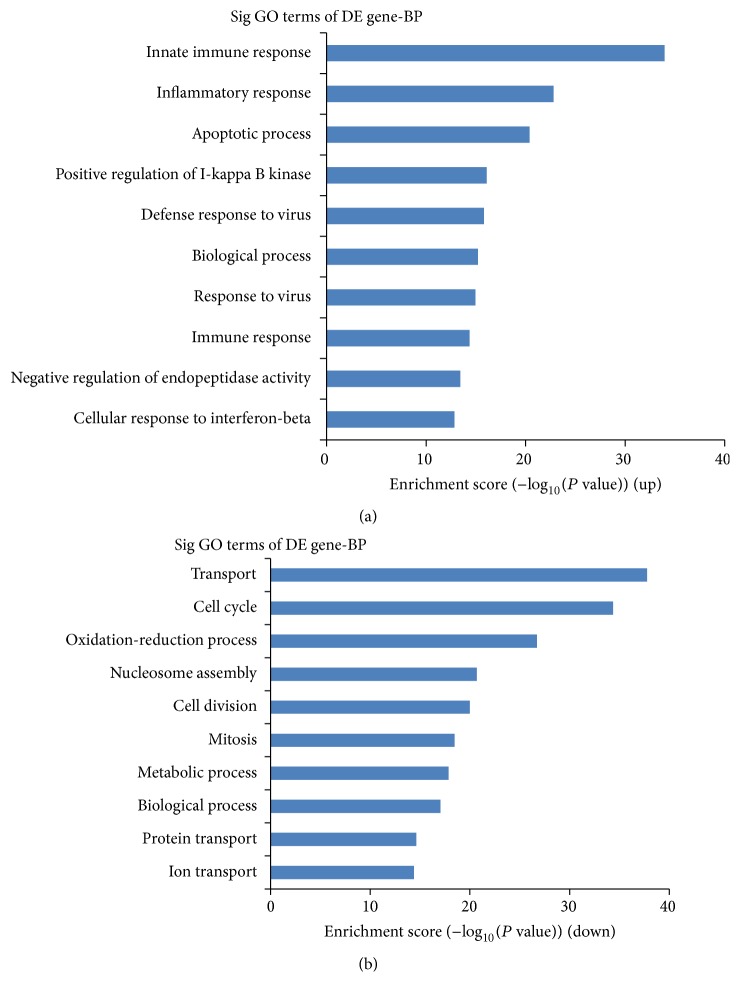
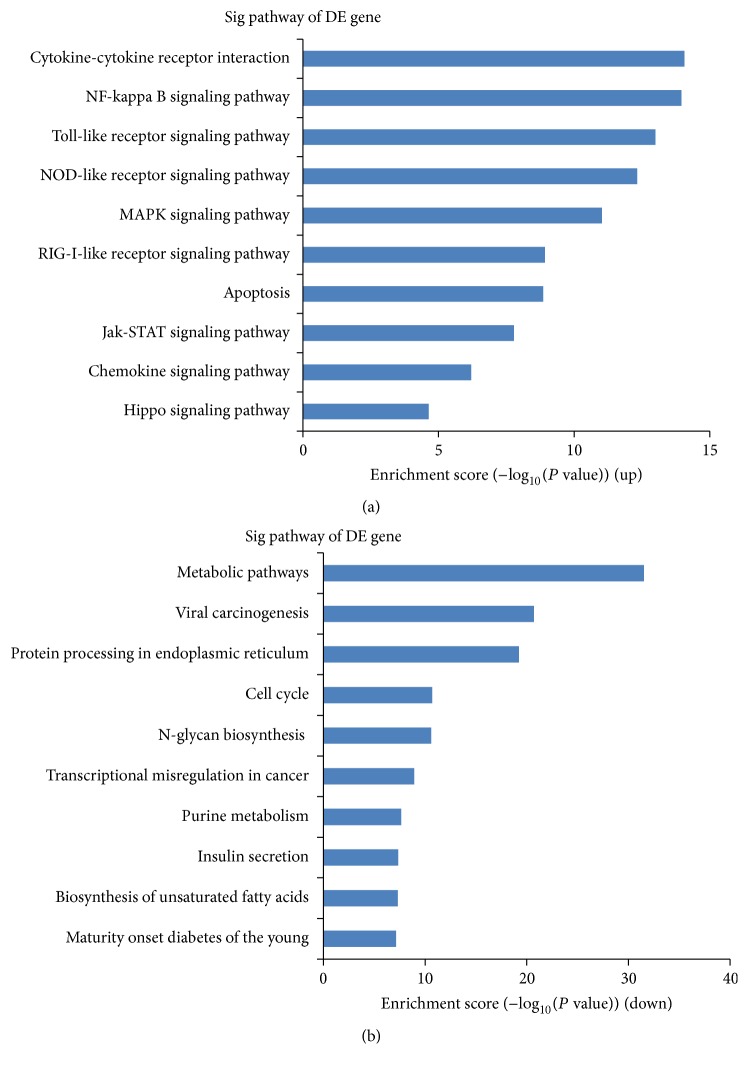
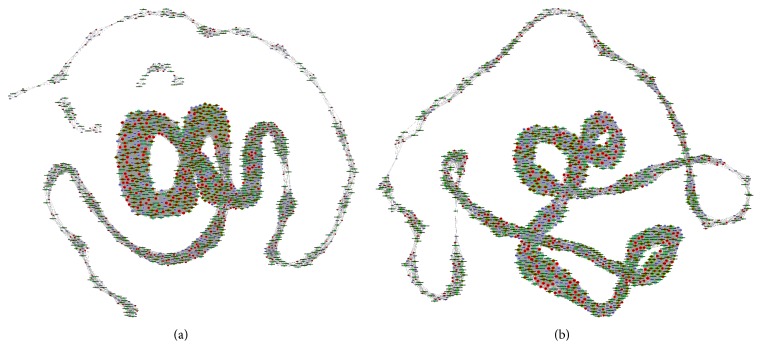
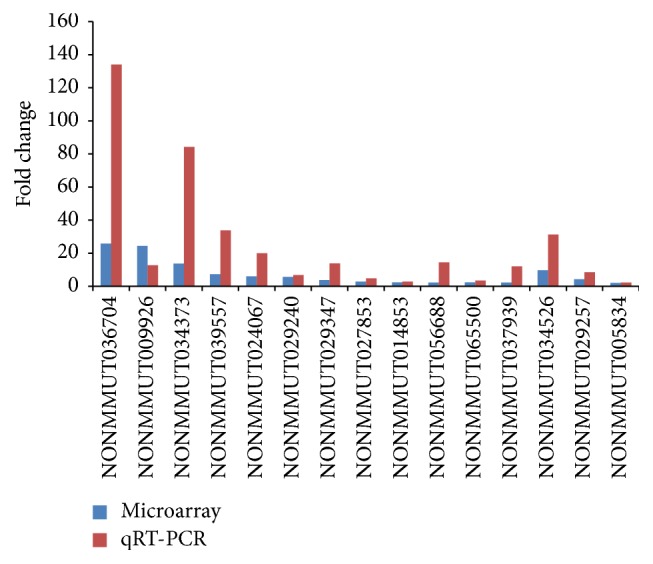
Type 1 diabetes mellitus (T1DM) is an organ-specific autoimmune disease characterized by chronic and progressive apoptotic destruction of pancreatic beta cells. During the initial phases of T1DM, cytokines and other inflammatory mediators released by immune cells progressively infiltrate islet cells, induce alterations in gene expression, provoke functional impairment, and ultimately lead to apoptosis. Long noncoding RNAs (lncRNAs) are a new important class of pervasive genes that have a variety of biological functions and play key roles in many diseases. However, whether they have a function in cytokine-induced beta cell apoptosis is still uncertain. In this study, lncRNA microarray technology was used to identify the differently expressed lncRNAs and mRNAs in MIN6 cells exposed to proinflammatory cytokines. Four hundred forty-four upregulated and 279 downregulated lncRNAs were detected with a set filter fold-change ≧2.0. To elucidate the potential functions of these lncRNAs, Gene Ontology (GO) and pathway analyses were used to evaluate the potential functions of differentially expressed lncRNAs. Additionally, a lncRNA-mRNA coexpression network was constructed to predict the interactions between the most strikingly regulated lncRNAs and mRNAs. This study may be utilized as a background or reference resource for future functional studies on lncRNAs related to the diagnosis and development of new therapies for T1DM.


Figures

Figure 1
Figure 1
Profile of microarray data. (a) Hierarchical clustering shows a distinguished lncRNAs expression profiling among groups. (b) Hierarchical clustering shows a distinguished mRNAs expression profiling among groups. The red and the green shades indicate the expression above and below the relative expression, respectively, across all samples.
Figure 2
Figure 2
The length distribution of dysregulated lncRNAs. The lncRNAs were mainly less than 500 and longer than 5000 bp.
Figure 3
Figure 3
Chromosome distribution of up- and downregulated lncRNAs location in different chromosomes.
Figure 4
Figure 4
GO analyses. (a) The top 10 GO terms that associated with coding gene function of upregulated lncRNAs are listed. (b) The top 10 GO terms that associated with coding gene function of downregulated lncRNAs are listed.
Figure 5
Figure 5
Pathway analyses. (a) The top 10 pathways that associated with coding gene of upregulated lncRNAs are listed. (b) The top 10 pathways that associated with coding gene of downregulated lncRNAs are listed.
Figure 6
Figure 6
The lncRNA-mRNA coexpression network. (a) The lncRNA-mRNA network containing the 625 filtered mRNAs and 723 filtered aberrant expressed lncRNAs in cytokine stimulation group. (b) The lncRNA-mRNA network containing the 625 filtered mRNAs and 723 filtered aberrant expressed lncRNAs in control group. Upregulated RNAs are shown in red, and downregulated RNAs are presented in purple. Nodes without a ring represent mRNAs, nodes with a ring represent lncRNAs, and node size represents the degree of centrality.
Figure 7
Figure 7
Comparison between microarray data and qRT-PCR result for lncRNAs. The validation results indicated that the microarray data correlated well with the qPCR results.

Similar articles

Cited by

References

    1. The DIAMOND Project Group. Incidence and trends of childhood Type 1 diabetes worldwide 1990–1999. Diabetic Medicine. 2006;23(8):857–866. doi: 10.1111/j.1464-5491.2006.01925.x. - DOI - PubMed
    1. Patterson C. C., Dahlquist G. G., Gyürüs E., Green A., Soltész G. Incidence trends for childhood type 1 diabetes in Europe during 1989–2003 and predicted new cases 2005–2020: a multicentre prospective registration study. The Lancet. 2009;373(9680):2027–2033. doi: 10.1016/s0140-6736(09)60568-7. - DOI - PubMed
    1. Patterson C. C., Gyürüs E., Rosenbauer J., et al. Trends in childhood type 1 diabetes incidence in Europe during 1989–2008: evidence of non-uniformity over time in rates of increase. Diabetologia. 2012;55(8):2142–2147. doi: 10.1007/s00125-012-2571-8. - DOI - PubMed
    1. Bendas A., Rothe U., Kiess W., et al. Trends in incidence rates during 1999–2008 and prevalence in 2008 of childhood type 1 diabetes mellitus in GERMANY—model-based national estimates. PLoS ONE. 2015;10(7) doi: 10.1371/journal.pone.0132716.e0132716 - DOI - PMC - PubMed
    1. Dabelea D., Mayer-Davis E. J., Saydah S., et al. Prevalence of type 1 and type 2 diabetes among children and adolescents from 2001 to 2009. The Journal of the American Medical Association. 2014;311(17):1778–1786. doi: 10.1001/jama.2014.3201. - DOI - PMC - PubMed

LinkOut - more resources