. 2016 Sep 19:7:359.
doi: 10.3389/fimmu.2016.00359. eCollection 2016.

Dexamethasone and Monophosphoryl Lipid A-Modulated Dendritic Cells Promote Antigen-Specific Tolerogenic Properties on Naive and Memory CD4+ T Cells

Affiliations

Dexamethasone and Monophosphoryl Lipid A-Modulated Dendritic Cells Promote Antigen-Specific Tolerogenic Properties on Naive and Memory CD4+ T Cells

Jaxaira Maggi et al. Front Immunol. .

Abstract

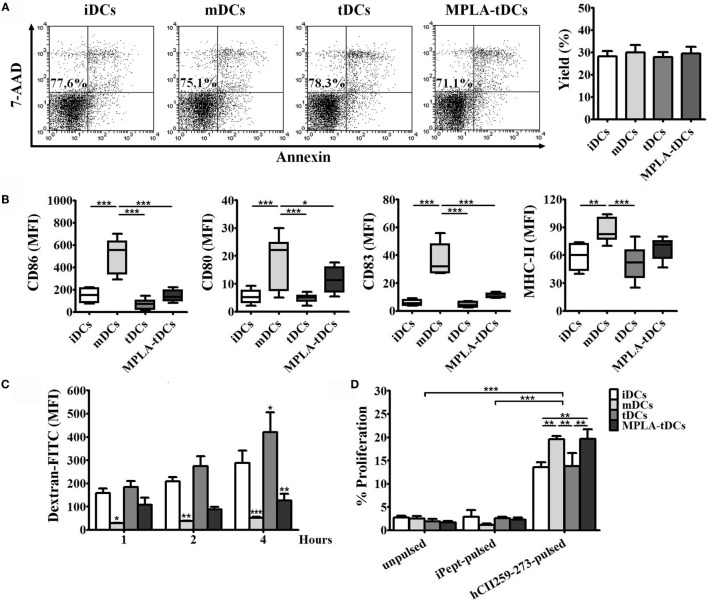
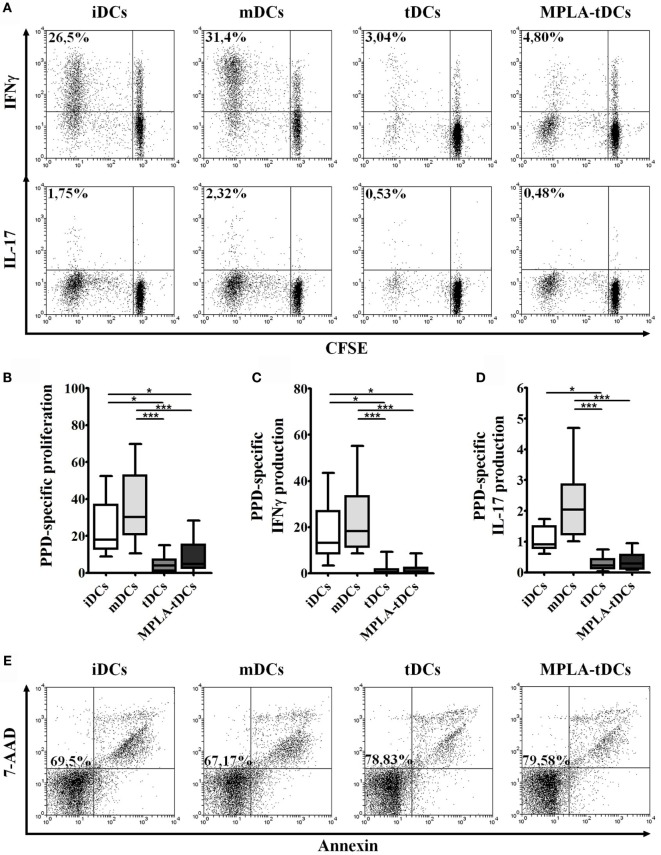
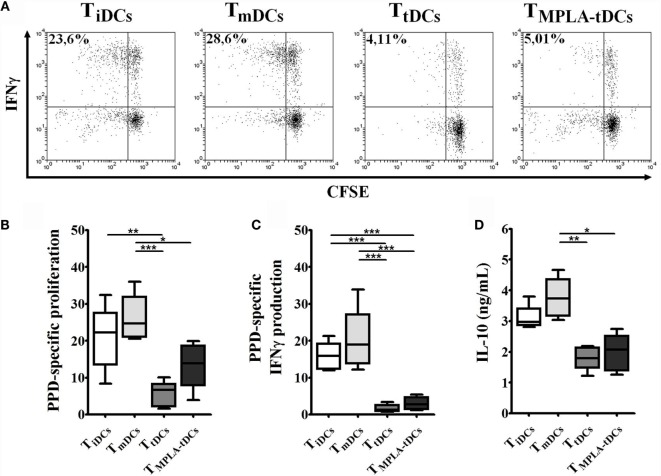
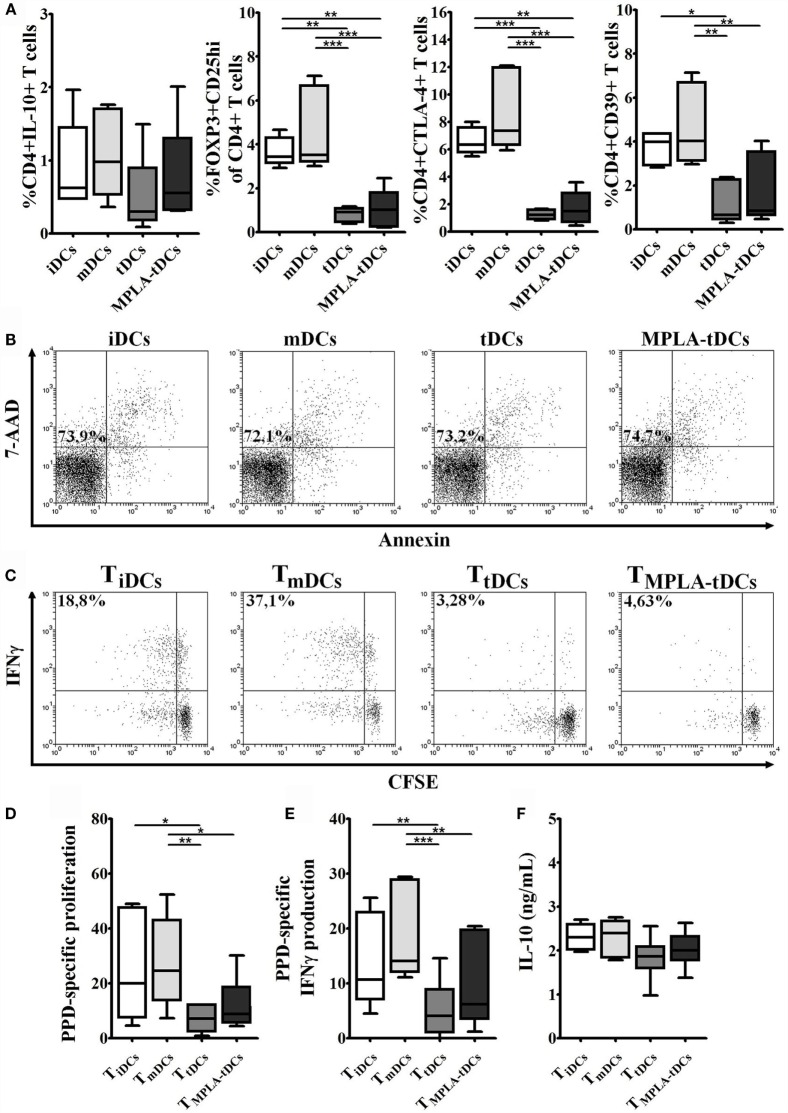
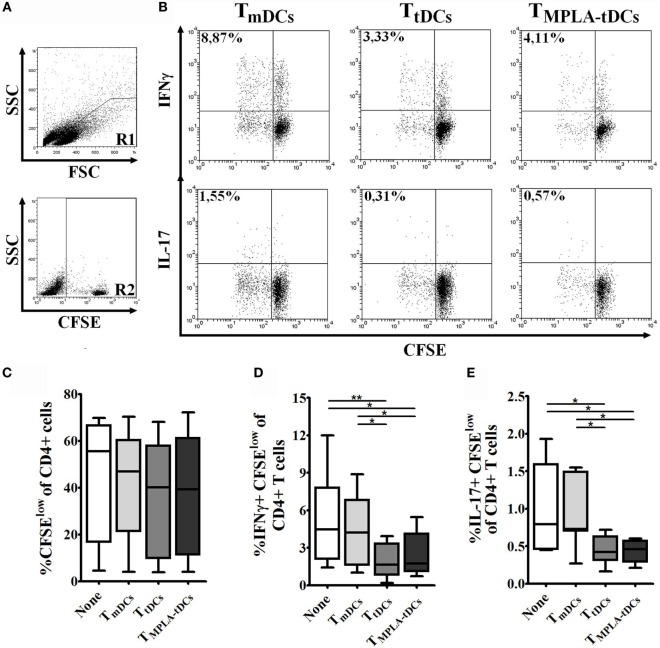
Tolerogenic dendritic cells (DCs) are a promising tool to control T cell-mediated autoimmunity. Here, we evaluate the ability of dexamethasone-modulated and monophosphoryl lipid A (MPLA)-activated DCs [MPLA-tolerogenic DCs (tDCs)] to exert immunomodulatory effects on naive and memory CD4+ T cells in an antigen-specific manner. For this purpose, MPLA-tDCs were loaded with purified protein derivative (PPD) as antigen and co-cultured with autologous naive or memory CD4+ T cells. Lymphocytes were re-challenged with autologous PPD-pulsed mature DCs (mDCs), evaluating proliferation and cytokine production by flow cytometry. On primed-naive CD4+ T cells, the expression of regulatory T cell markers was evaluated and their suppressive ability was assessed in autologous co-cultures with CD4+ effector T cells and PPD-pulsed mDCs. We detected that memory CD4+ T cells primed by MPLA-tDCs presented reduced proliferation and proinflammatory cytokine expression in response to PPD and were refractory to subsequent stimulation. Naive CD4+ T cells were instructed by MPLA-tDCs to be hyporesponsive to antigen-specific restimulation and to suppress the induction of T helper cell type 1 and 17 responses. In conclusion, MPLA-tDCs are able to modulate antigen-specific responses of both naive and memory CD4+ T cells and might be a promising strategy to "turn off" self-reactive CD4+ effector T cells in autoimmunity.

Keywords: hyporesponsiveness; immunotherapy; memory CD4+ T cells; monocyte-derived dendritic cells; naive CD4+ T cells; tolerance.


Figures

Figure 1
Figure 1
MPLA-tDCs are characterized by low expression of maturation markers, diminished endocytosis ability, and the capability to present antigen efficiently. For the induction of a tolerogenic state, DCs were conditioned with dexamethasone (Dex) and were additionally activated with MPLA (MPLA-tDCs). Untreated DCs (iDCs), Dex-modulated DCs (tDCs), and MPLA-matured DCs (mDCs) were used as controls. (A) Representative dot plots of cell viability measured after 5 days of culture and expressed as the percentage of annexin-V and 7-AAD-negative cells are shown, and DC yield is expressed as a percentage of DCs obtained on day 5 related to the initial number of monocytes cultured per condition (mean ± SEM) (n = 10). (B) Surface expression levels of CD86, CD80, CD83, and HLA-DR were assessed by flow cytometry. Graphic analyses of MFI measurements are expressed as box-and-whiskers plot from minimum to maximum values (n = 6). Statistical differences were calculated using one-way ANOVA for repeated measures followed by Tukey post-test (*P < 0.05; **P < 0.01; ***P < 0.001). (C) Endocytosis capacity was assessed by incubating DCs with dextran-FITC during 1, 2, and 4 h. Results are expressed as the difference between MFI of cells incubated at 37 and 4°C with the antigen and are represented as the mean ± SEM of four independent experiments. Significant differences are expressed in relation to iDCs condition. (D) For evaluating antigen-presentation ability, DCs generated from HLA-DRB1*0101 donors were pulsed with the human type II collagen peptide (hCII259–273) and co-cultured with the HLA-DR1-restricted T cell hybridoma (hCII-9.1). Unpulsed DCs and DCs loaded with an irrelevant chicken peptide (iPept) were used as controls. Graphs show the proliferative responses of CTLL-2 cells incubated with supernatants obtained from those co-cultures and assessed by flow cytometry. Data are represented as the mean ± SEM of three independent experiments. For (C,D), statistical differences were calculated using two-way ANOVA followed by Bonferroni post-test (*P < 0.05; **P < 0.01; ***P < 0.001).
Figure 2
Figure 2
MPLA-tDCs modulate memory CD4+ T cells responses in an antigen-specific way. For the assessment of their T cell-stimulatory capacity, PPD-pulsed DCs were co-cultured with autologous CFSE-labeled memory CD4+ T cells. Un-loaded DCs were used as control. Data were normalized by subtracting values of unpulsed conditions to antigen-specific conditions. (A) Representative dot plots of IFN-γ (top) and IL-17 (bottom) expression from 10 independent experiments are shown. (B) Proliferation of CD4+ T cells was determined by CFSE dilution through flow cytometry, and graphic representation of normalized data of the percentage of CFSElow in CD4+ T cells is shown. (C) IFN-γ and (D) IL-17 expression was detected intracellularly and analyzed by flow cytometry. Graphic representation of normalized data of the percentage of IFN-γ and IL-17 producing proliferating CD4+ T cells (CFSElow) is shown. In (B–D), statistical differences were calculated using Friedman test followed by Duns post-test (*P < 0.05; ***P < 0.001). (E) Representative dot plots of cell viability measured after 6 days of co-culture and expressed as the percentage of annexin-V and 7-AAD-negative cells are shown.
Figure 3
Figure 3
MPLA-tDCs render memory CD4+ T cells to be hyporesponsive to restimulation. For restimulation assays, memory CD4+ T cells were primed with PPD-loaded DC subsets and then were recovered, washed, labeled with CFSE, and restimulated with unpulsed or PPD-pulsed mDCs. Data were normalized by subtracting values of unpulsed conditions to antigen-specific conditions. (A) Representative dot plots of IFN-γ expression from six independent experiments are shown. (B) Proliferation of restimulated primed-CD4+ T cells was determined by CFSE dilution through flow cytometry and graphic representation of normalized data of the percentage of CFSElow in CD4+ T cells is shown. (C) IFN-γ expression was detected intracellularly and analyzed by flow cytometry. Graphic representation of normalized data of the percentage of IFN-γ producing proliferating CD4+ T cells (CFSElow) is shown. (D) IL-10 secretion levels from mDC/primed-T cell co-culture supernatants were measured using ELISA. For (B–D), statistical differences were calculated using Friedman test (for non-parametric data) or one-way ANOVA (for normally distributed data) followed by Duns or Tukey post-test, respectively (*P < 0.05; **P < 0.01; ***P < 0.001).
Figure 4
Figure 4
Naive CD4+ T cells primed by MPLA-tDCs do not exhibit a regulatory phenotype and become hyporesponsive to restimulation. MPLA-tDCs ability to induce phenotypic regulatory properties on naive CD4+ T cells after co-culturing was evaluated. (A) Expression of IL-10, FOXP3 in combination to CD25, CTLA-4, and CD39 was evaluated by flow cytometry. Graphic analyses of MFI measurements are expressed as box-and-whiskers plot from minimum to maximum values (n = 5). Statistical differences were calculated using Friedman test (for non-parametric data) or one-way ANOVA (for normally distributed data) followed by Duns or Tukey post-test, respectively (*P < 0.05; **P < 0.01; ***P < 0.001). (B) Representative dot plots of cell viability measured after 6 days of co-culture and expressed as the percentage of annexin-V and 7-AAD-negative cells are shown. For restimulation assays, naive CD4+ T cells were primed with PPD-loaded DC subsets and then were recovered, washed, labeled with CFSE, and restimulated with unpulsed or PPD-pulsed mDCs. Data were normalized by subtracting values of unpulsed conditions to antigen-specific conditions. (C) Representative dot plots of IFN-γ expression from six independent experiments are shown. (D) Proliferation of restimulated primed-CD4+ T cells was determined by CFSE dilution through flow cytometry, and graphic representation of normalized data of the percentage of CFSElow in CD4+ T cells is shown. (E) IFN-γ expression was detected intracellularly and analyzed by flow cytometry. Graphic representation of normalized data of the percentage of IFN-γ producing proliferating CD4+ T cells (CFSElow) is shown. (F) IL-10 secretion levels from mDC/primed-T cell co-culture supernatants were measured using ELISA. For (D–F), statistical differences were calculated using one-way ANOVA followed by Tukey post-test (*P < 0.05; **P < 0.01; ***P < 0.001).
Figure 5
Figure 5
MPLA-tDCs endow naive CD4+ T cells with the ability to suppress Th1 and Th17 responses. To evaluate the ability of MPLA-tDCs to induce functional regulatory properties on naive CD4+ T cells, these cells were primed with PPD-loaded DC subsets and then were recovered, washed, and added to a co-culture of CFSE-labeled responder CD4+ T cells and PPD-pulsed mDCs. Responder CD4+ T cells co-cultured with mDCs and without the addition of primed-naive CD4+ T cells were used as control. (A) Gate strategy is shown: R1 = lymphocytes region, R2 = CFSE + population. (B) Representative dot plots of IFN-γ (top) and IL-17 (bottom) expression from seven independent experiments are shown. (C) Proliferation of responder CD4+ T cells in presence of primed-naive CD4+ T cells was determined by CFSE dilution through flow cytometry, and graphic representation of the percentage of CFSElow in CD4+ T cells is shown. (D) IFN-γ and (E) IL-17 expression were detected intracellularly and analyzed by flow cytometry. Graphic representation of the percentage of IFN-γ and IL-17 producing proliferating CD4+ T cells (CFSElow) is shown. For (C–E), statistical differences were calculated using one-way ANOVA followed by Tukey post-test (*P < 0.05; **P < 0.01).

Similar articles

Cited by

References

    1. Glück T, Kiefmann B, Grohmann M, Falk W, Straub RH, Schölmerich J. Immune status and risk for infection in patients receiving chronic immunosuppressive therapy. J Rheumatol (2005) 32(8):1473–80. - PubMed
    1. Gutierrez-Dalmau A, Campistol JM. Immunosuppressive therapy and malignancy in organ transplant recipients: a systematic review. Drugs (2007) 67(8):1167–98.10.2165/00003495-200767080-00006 - DOI - PubMed
    1. van Duivenvoorde L, van Mierlo G, Boonman Z, Toes R. Dendritic cells: vehicles for tolerance induction and prevention of autoimmune diseases. Immunobiology (2006) 211(6–8):627–32.10.1016/j.imbio.2006.05.014 - DOI - PubMed
    1. Banchereau J, Steinman R. Dendritic cells and the control of immunity. Nature (1998) 392(6673):245–52.10.1038/32588 - DOI - PubMed
    1. Moser M. Dendritic cells in immunity and tolerance – do they display opposite functions? Immunity (2003) 19(1):5–8.10.1016/S1074-7613(03)00182-1 - DOI - PubMed