

Molecular Characterization and Enhancement of Anticancer Activity of Caffeic Acid Phenethyl Ester by γ Cyclodextrin
- PMID: 27698914
- PMCID: PMC5039358
- DOI: 10.7150/jca.15170
Molecular Characterization and Enhancement of Anticancer Activity of Caffeic Acid Phenethyl Ester by γ Cyclodextrin
Abstract
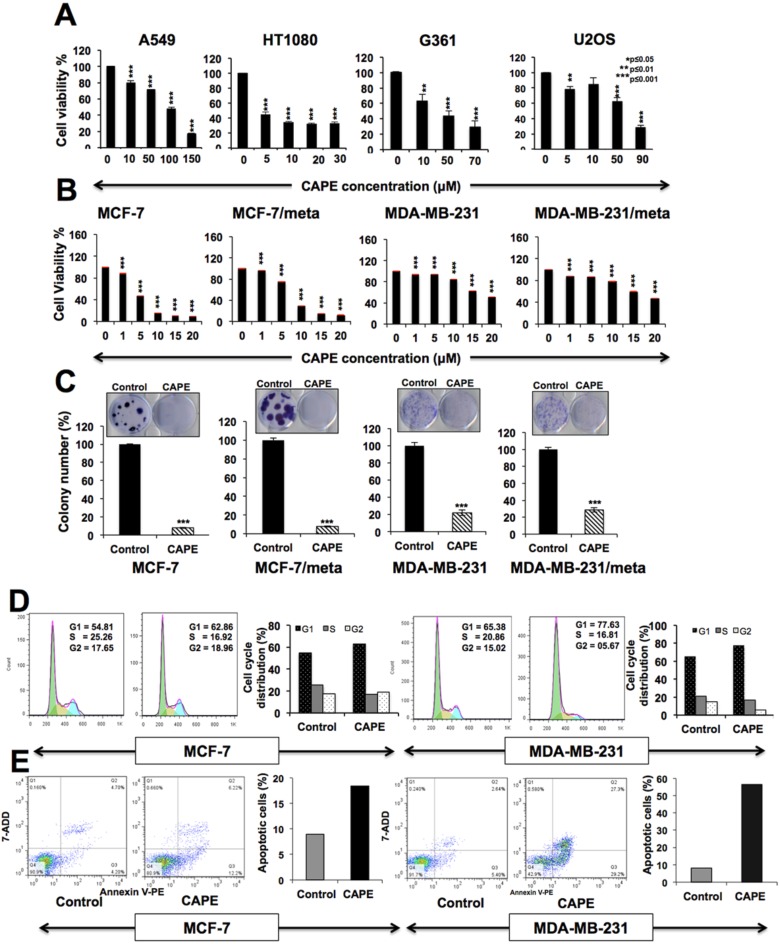
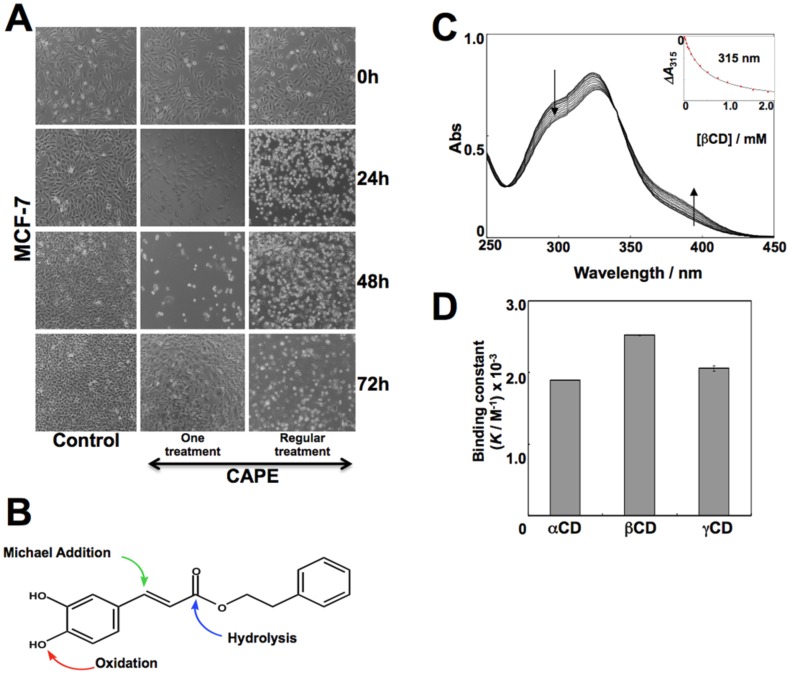
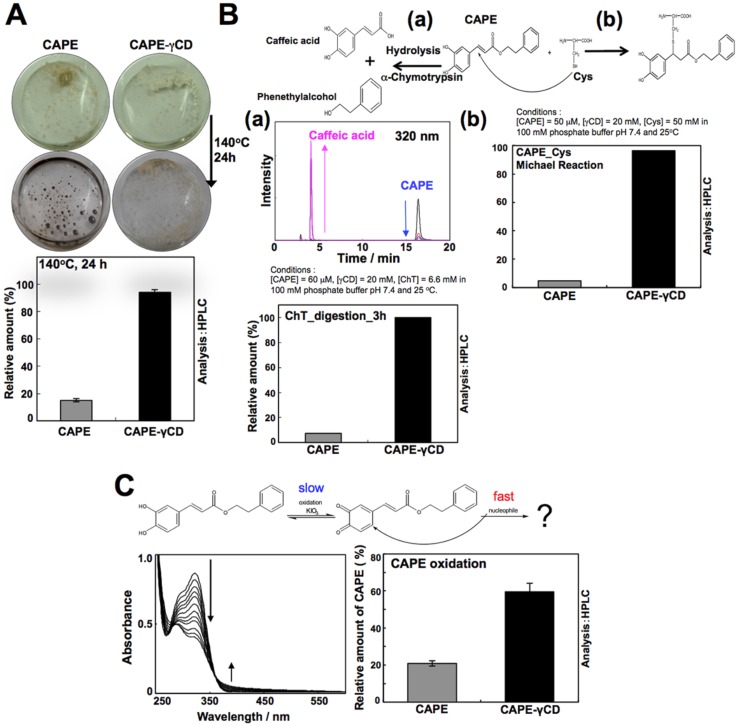
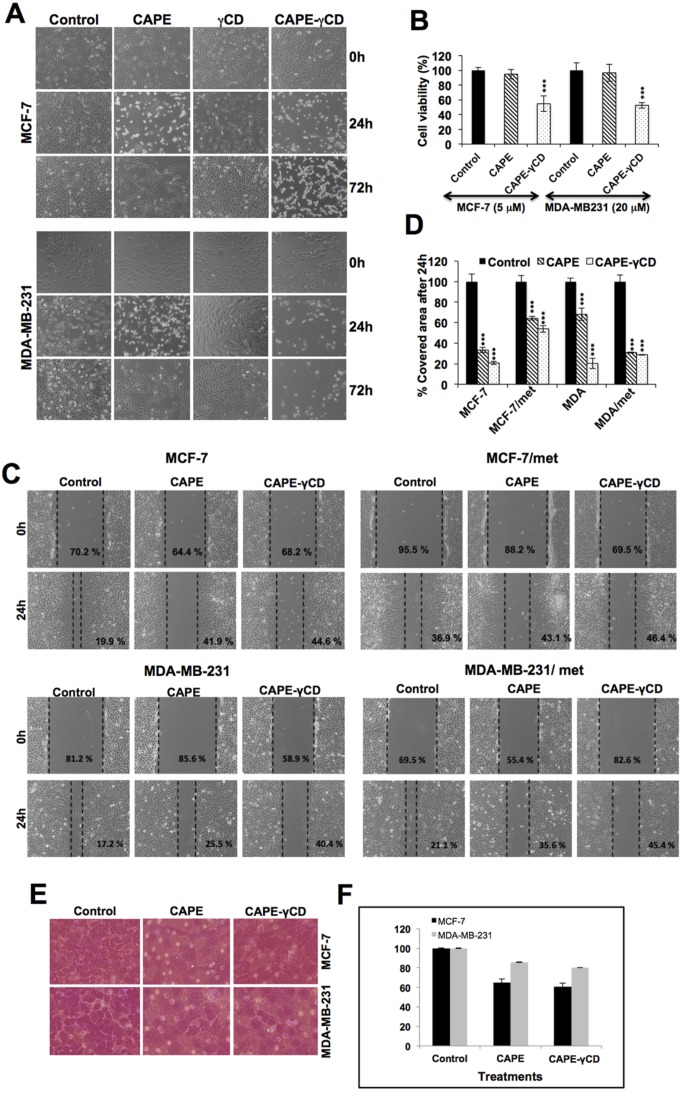
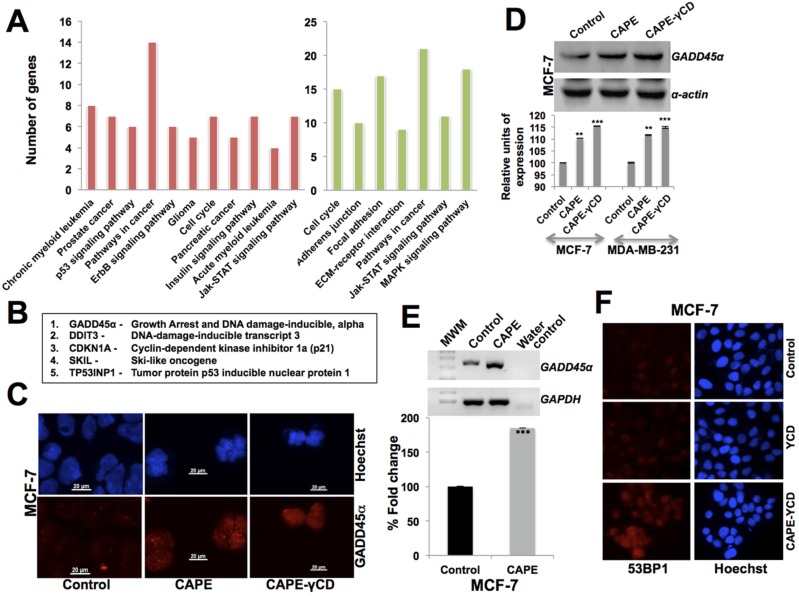
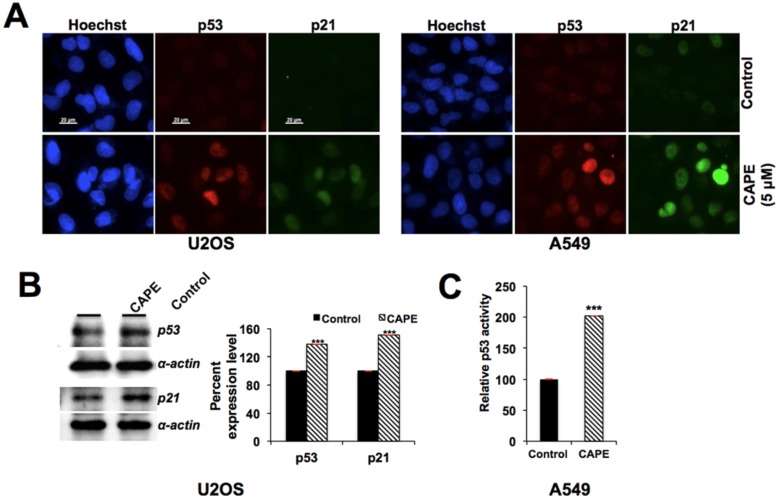
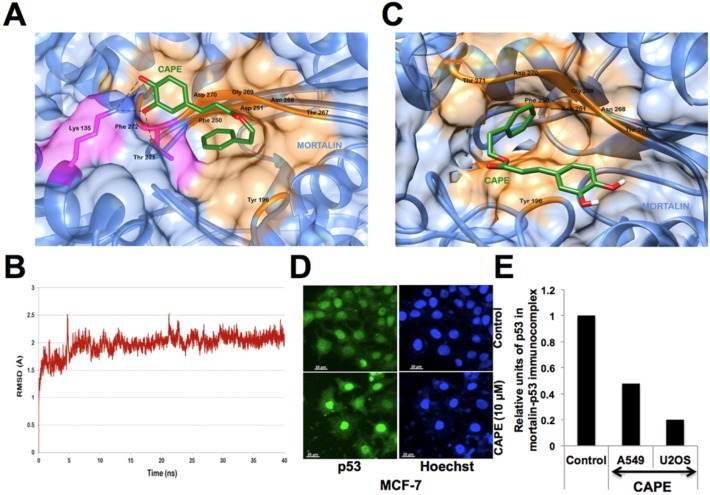
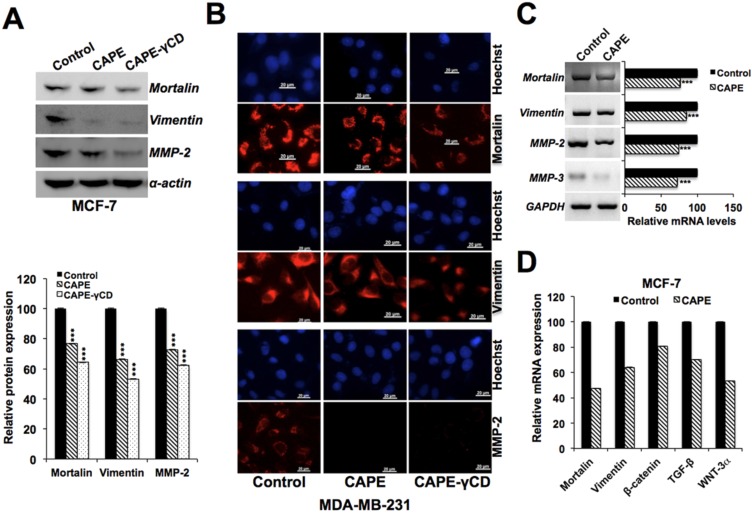
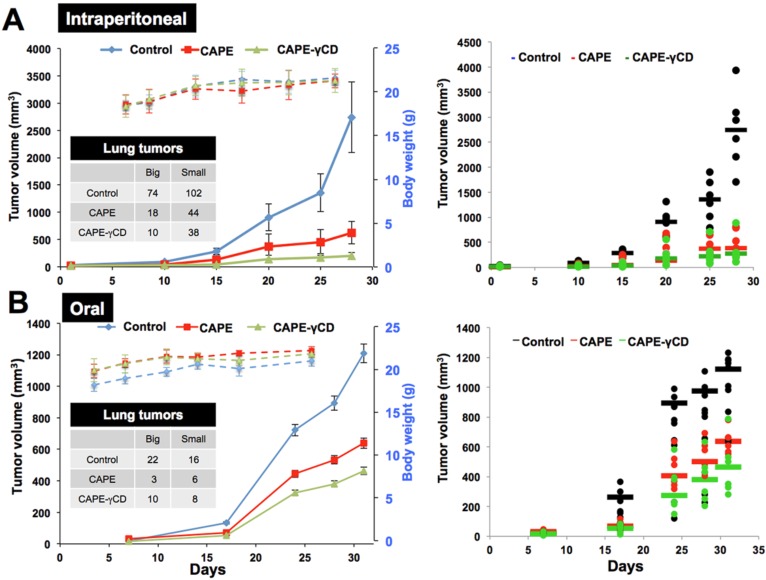
Caffeic Acid Phenethyl Ester (CAPE) is a key component in New Zealand propolis, known for a variety of health promoting and therapeutic potentials. We investigated the molecular mechanism of anticancer and anti-metastasis activities of CAPE. cDNA array performed on the control and CAPE-treated breast cancer cells revealed activation of DNA damage signaling involving upregulation of GADD45α and p53 tumor suppressor proteins. Molecular docking analysis revealed that CAPE is capable of disrupting mortalin-p53 complexes. We provide experimental evidence and demonstrate that CAPE induced disruption of mortalin-p53 complexes led to nuclear translocation and activation of p53 resulting in growth arrest in cancer cells. Furthermore, CAPE-treated cells exhibited downregulation of mortalin and several other key regulators of cell migration accountable for its anti-metastasis activity. Of note, we found that whereas CAPE was unstable in the culture medium (as it gets degraded into caffeic acid by secreted esterases), its complex with gamma cyclodextrin (γCD) showed high efficacy in anti-tumor and anti-metastasis assays in vitro and in vivo (when administered through either intraperitoneal or oral route). The data proposes that CAPE-γCD complex is a potent anti-cancer and anti-metastasis reagent.
Keywords: CAPE; Propolis; anti-metastasis.; anticancer; complex; p53; upregulation; γCD.
Conflict of interest statement
The authors have declared that no competing interest exists.
Figures
Similar articles
-
Anticancer Activity in Honeybee Propolis: Functional Insights to the Role of Caffeic Acid Phenethyl Ester and Its Complex With γ-Cyclodextrin.Integr Cancer Ther. 2018 Sep;17(3):867-873. doi: 10.1177/1534735417753545. Epub 2018 Feb 2. Integr Cancer Ther. 2018. PMID: 29390900 Free PMC article.
-
Novel Caffeic Acid Phenethyl Ester-Mortalin Antibody Nanoparticles Offer Enhanced Selective Cytotoxicity to Cancer Cells.Cancers (Basel). 2020 Aug 21;12(9):2370. doi: 10.3390/cancers12092370. Cancers (Basel). 2020. PMID: 32825706 Free PMC article.
-
Anticancer activity of the supercritical extract of Brazilian green propolis and its active component, artepillin C: Bioinformatics and experimental analyses of its mechanisms of action.Int J Oncol. 2018 Mar;52(3):925-932. doi: 10.3892/ijo.2018.4249. Epub 2018 Jan 22. Int J Oncol. 2018. PMID: 29393408
-
Antiviral properties of caffeic acid phenethyl ester and its potential application.J Intercult Ethnopharmacol. 2015 Oct-Dec;4(4):344-7. doi: 10.5455/jice.20151012013034. Epub 2015 Nov 5. J Intercult Ethnopharmacol. 2015. PMID: 26649239 Free PMC article. Review.
-
The anticancer mechanism of caffeic acid phenethyl ester (CAPE): review of melanomas, lung and prostate cancers.Eur Rev Med Pharmacol Sci. 2012 Dec;16(15):2064-8. Eur Rev Med Pharmacol Sci. 2012. PMID: 23280020 Review.
Cited by
-
A New Controlled Release System for Propolis Polyphenols and Its Biochemical Activity for Skin Applications.Plants (Basel). 2021 Feb 23;10(2):420. doi: 10.3390/plants10020420. Plants (Basel). 2021. PMID: 33672417 Free PMC article.
-
Caffeic Acid Phenethyl Ester as a DHODH Inhibitor and Its Synergistic Anticancer Properties in Combination with 5-Fluorouracil in a Breast Cancer Cell Line.J Exp Pharmacol. 2022 Jul 23;14:243-253. doi: 10.2147/JEP.S365159. eCollection 2022. J Exp Pharmacol. 2022. PMID: 35910085 Free PMC article.
-
The Effect of Natural Substances Contained in Bee Products on Prostate Cancer in In Vitro Studies.Molecules. 2023 Jul 28;28(15):5719. doi: 10.3390/molecules28155719. Molecules. 2023. PMID: 37570691 Free PMC article.
-
Do Young Consumers Care about Antioxidant Benefits and Resveratrol and Caffeic Acid Consumption?Nutrients. 2024 May 10;16(10):1439. doi: 10.3390/nu16101439. Nutrients. 2024. PMID: 38794677 Free PMC article.
-
Cyclodextrins, Natural Compounds, and Plant Bioactives-A Nutritional Perspective.Biomolecules. 2021 Mar 9;11(3):401. doi: 10.3390/biom11030401. Biomolecules. 2021. PMID: 33803150 Free PMC article. Review.
References
-
- Han Y, Zhang Y, Jia T, Sun Y. Molecular mechanism underlying the tumor-promoting functions of carcinoma-associated fibroblasts. Tumour Biol. 2015;36:1385–94. - PubMed
LinkOut - more resources
Full Text Sources
Other Literature Sources
Research Materials
Miscellaneous
