

Specific Inhibition of DNMT3A/ISGF3γ Interaction Increases the Temozolomide Efficiency to Reduce Tumor Growth
- PMID: 27698935
- PMCID: PMC5039338
- DOI: 10.7150/thno.9150
Specific Inhibition of DNMT3A/ISGF3γ Interaction Increases the Temozolomide Efficiency to Reduce Tumor Growth
Abstract
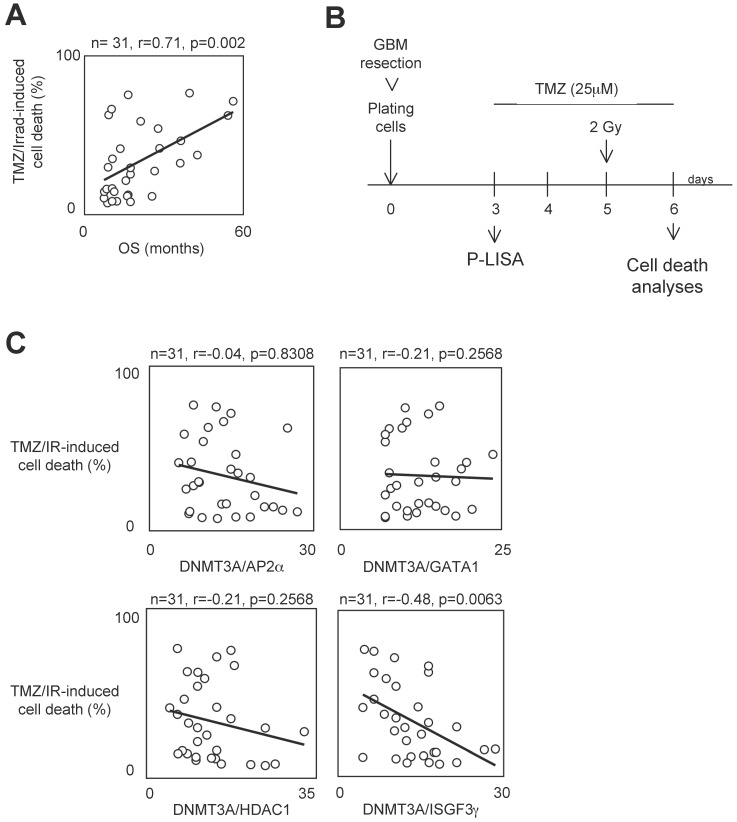
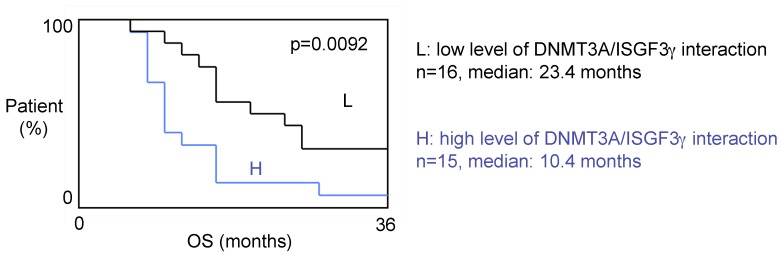
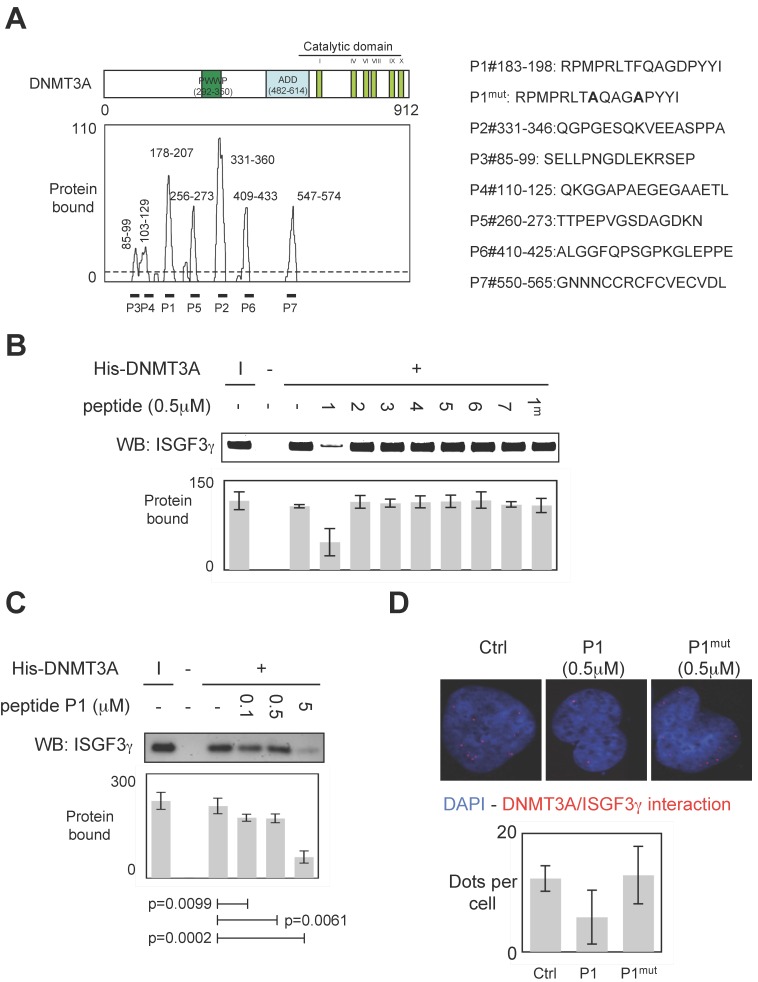
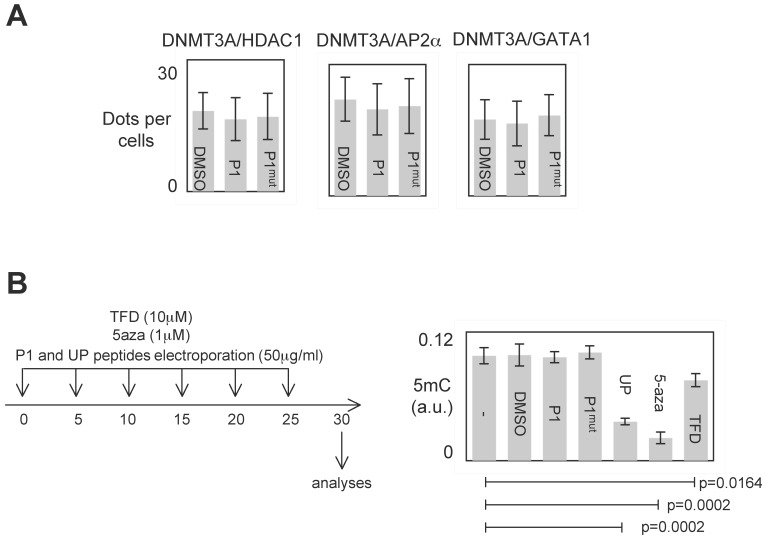
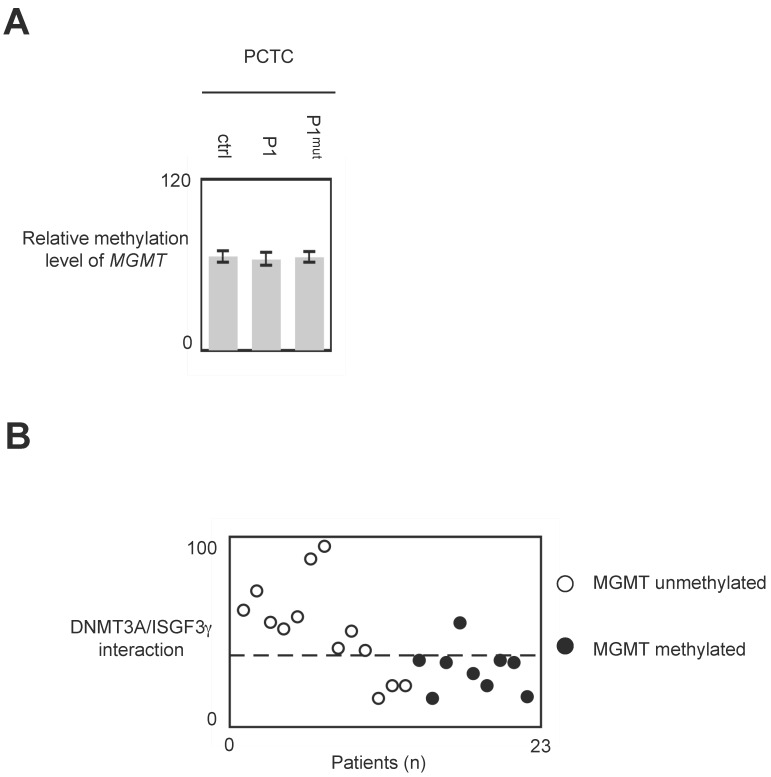
DNA methylation is a fundamental feature of genomes and is a candidate for pharmacological manipulation that might have important therapeutic advantage. Thus, DNA methyltransferases (DNMTs) appear to be ideal targets for drug intervention. By focusing on interactions existing between DNMT3A and DNMT3A-binding protein (D3A-BP), our work identifies the DNMT3A/ISGF3γ interaction such as a biomarker whose the presence level is associated with a poor survival prognosis and with a poor prognosis of response to the conventional chemotherapeutic treatment of glioblastoma multiforme (radiation plus temozolomide). Our data also demonstrates that the disruption of DNMT3A/ISGF3γ interactions increases the efficiency of chemotherapeutic treatment on established tumors in mice. Thus, our data opens a promising and innovative alternative to the development of specific DNMT inhibitors.
Keywords: DNA methylation; DNMT; DNMT inhibitor; GBM.; epigenetic; glioma.
Conflict of interest statement
The authors have declared that no competing interest exists.
Figures
Similar articles
-
Specific inhibition of DNMT1/CFP1 reduces cancer phenotypes and enhances chemotherapy effectiveness.Epigenomics. 2014 Jun;6(3):267-75. doi: 10.2217/epi.14.18. Epigenomics. 2014. PMID: 25111481
-
Combined cimetidine and temozolomide, compared with temozolomide alone: significant increases in survival in nude mice bearing U373 human glioblastoma multiforme orthotopic xenografts.J Neurosurg. 2005 Apr;102(4):706-14. doi: 10.3171/jns.2005.102.4.0706. J Neurosurg. 2005. PMID: 15871514
-
MGMT promoter methylation correlates with survival benefit and sensitivity to temozolomide in pediatric glioblastoma.Pediatr Blood Cancer. 2007 Apr;48(4):403-7. doi: 10.1002/pbc.20803. Pediatr Blood Cancer. 2007. PMID: 16609952
-
Drug Insight: temozolomide as a treatment for malignant glioma--impact of a recent trial.Nat Clin Pract Neurol. 2005 Dec;1(2):88-95. doi: 10.1038/ncpneuro0045. Nat Clin Pract Neurol. 2005. PMID: 16932504 Review.
-
Molecular mechanisms of temozolomide resistance in glioblastoma multiforme.Expert Rev Anticancer Ther. 2012 May;12(5):635-42. doi: 10.1586/era.12.37. Expert Rev Anticancer Ther. 2012. PMID: 22594898 Review.
Cited by
-
Targeting ARNT attenuates chemoresistance through destabilizing p38α-MAPK signaling in glioblastoma.Cell Death Dis. 2024 May 28;15(5):366. doi: 10.1038/s41419-024-06735-1. Cell Death Dis. 2024. PMID: 38806469 Free PMC article.
-
Misregulation of the expression and activity of DNA methyltransferases in cancer.NAR Cancer. 2021 Dec 1;3(4):zcab045. doi: 10.1093/narcan/zcab045. eCollection 2021 Dec. NAR Cancer. 2021. PMID: 34870206 Free PMC article.
-
Activation of JNK and p38 MAPK Mediated by ZDHHC17 Drives Glioblastoma Multiforme Development and Malignant Progression.Theranostics. 2020 Jan 1;10(3):998-1015. doi: 10.7150/thno.40076. eCollection 2020. Theranostics. 2020. PMID: 31938047 Free PMC article.
-
Epigenetic regulation of tumor-immune symbiosis in glioma.Trends Mol Med. 2024 May;30(5):429-442. doi: 10.1016/j.molmed.2024.02.004. Epub 2024 Mar 7. Trends Mol Med. 2024. PMID: 38453529 Free PMC article. Review.
-
miR-370-3p Is a Therapeutic Tool in Anti-glioblastoma Therapy but Is Not an Intratumoral or Cell-free Circulating Biomarker.Mol Ther Nucleic Acids. 2018 Dec 7;13:642-650. doi: 10.1016/j.omtn.2018.09.007. Epub 2018 Sep 13. Mol Ther Nucleic Acids. 2018. PMID: 30497054 Free PMC article.
References
-
- Esteller M. Epigenetics in cancer. N Engl J Med. 2008;358:1148–59. - PubMed
-
- Eden A, Gaudet F, Waghmare A, Jaenisch R. Chromosomal instability and tumors promoted by DNA hypomethylation. Science. 2003;300:455. - PubMed
-
- Toraño E, Petrus S, Fernandez A, Fraga M. Global DNA hypomethylation in cancer: review of validated methods and clinical significance. Clin Chem Lab Med. 2012;50:1733–42. - PubMed
-
- Fukushige S, Horii A. DNA methylation in cancer: a gene silencing mechanism and the clinical potential of its biomarkers. Tohoku J Exp Med. 2013;229:173–85. - PubMed
MeSH terms
Substances
LinkOut - more resources
Full Text Sources
Other Literature Sources
