

Optimization of Early Response Monitoring and Prediction of Cancer Antiangiogenesis Therapy via Noninvasive PET Molecular Imaging Strategies of Multifactorial Bioparameters
- PMID: 27698942
- PMCID: PMC5039682
- DOI: 10.7150/thno.13917
Optimization of Early Response Monitoring and Prediction of Cancer Antiangiogenesis Therapy via Noninvasive PET Molecular Imaging Strategies of Multifactorial Bioparameters
Abstract
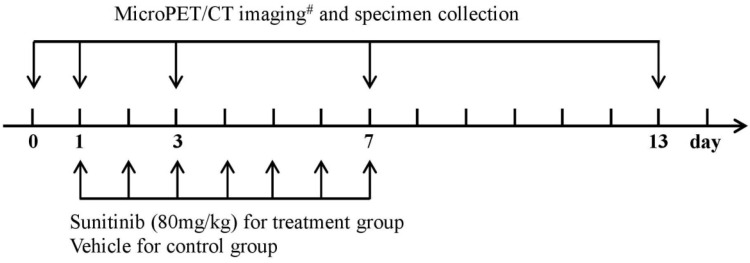
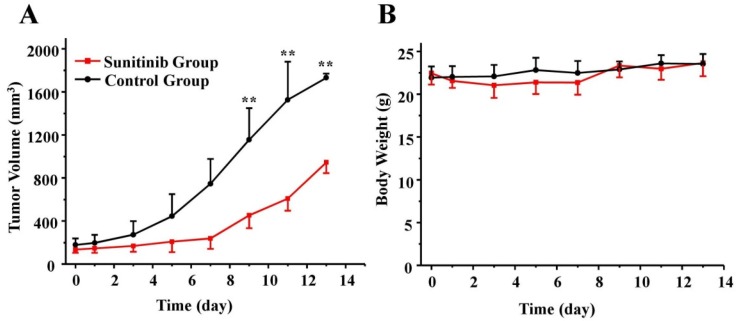
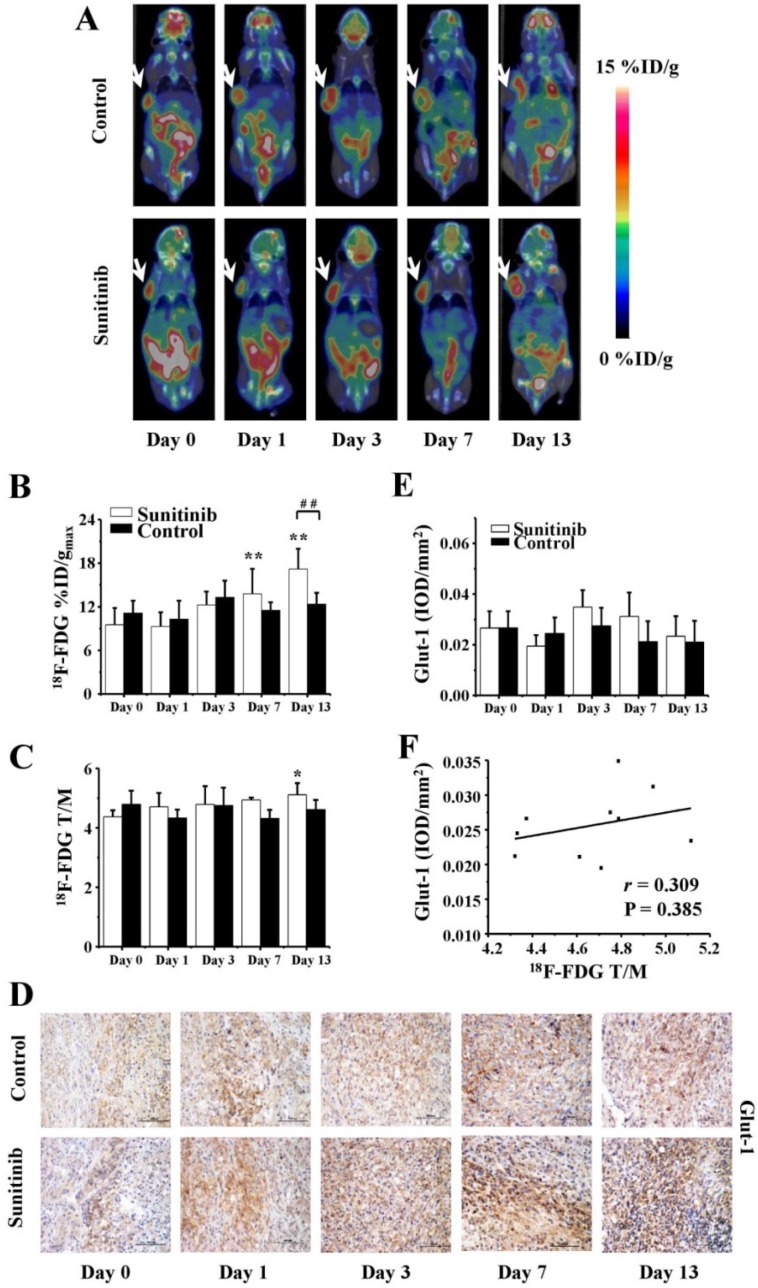
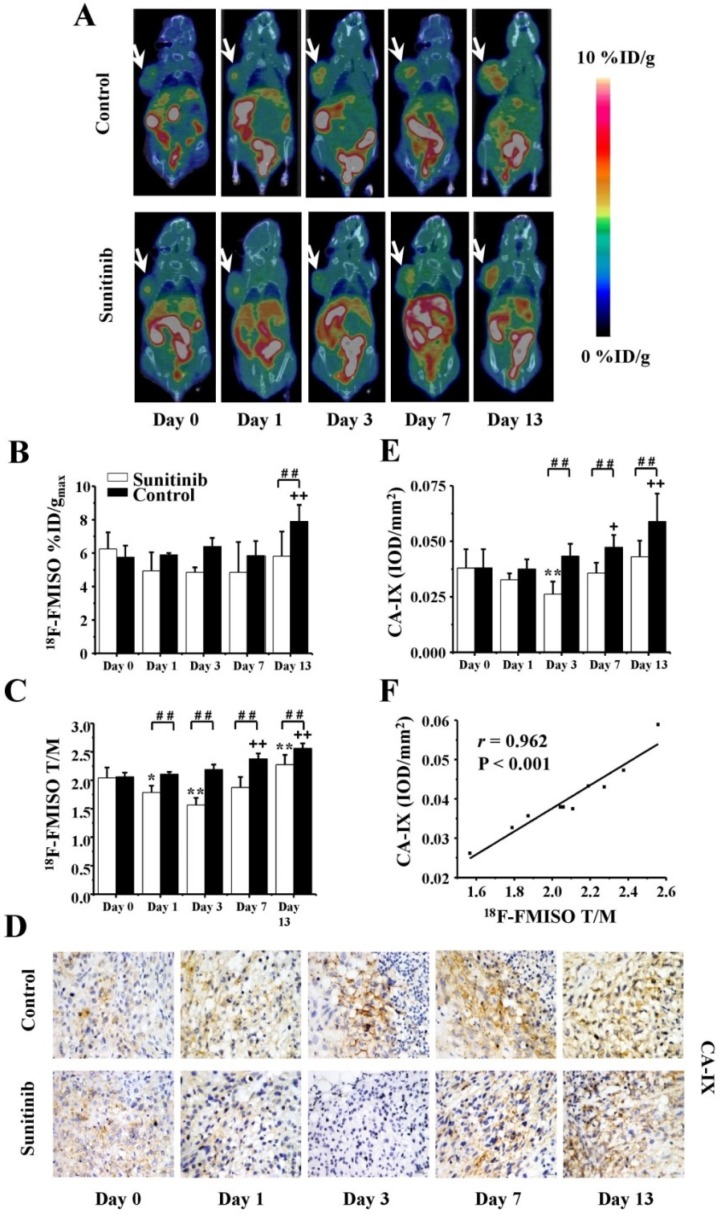
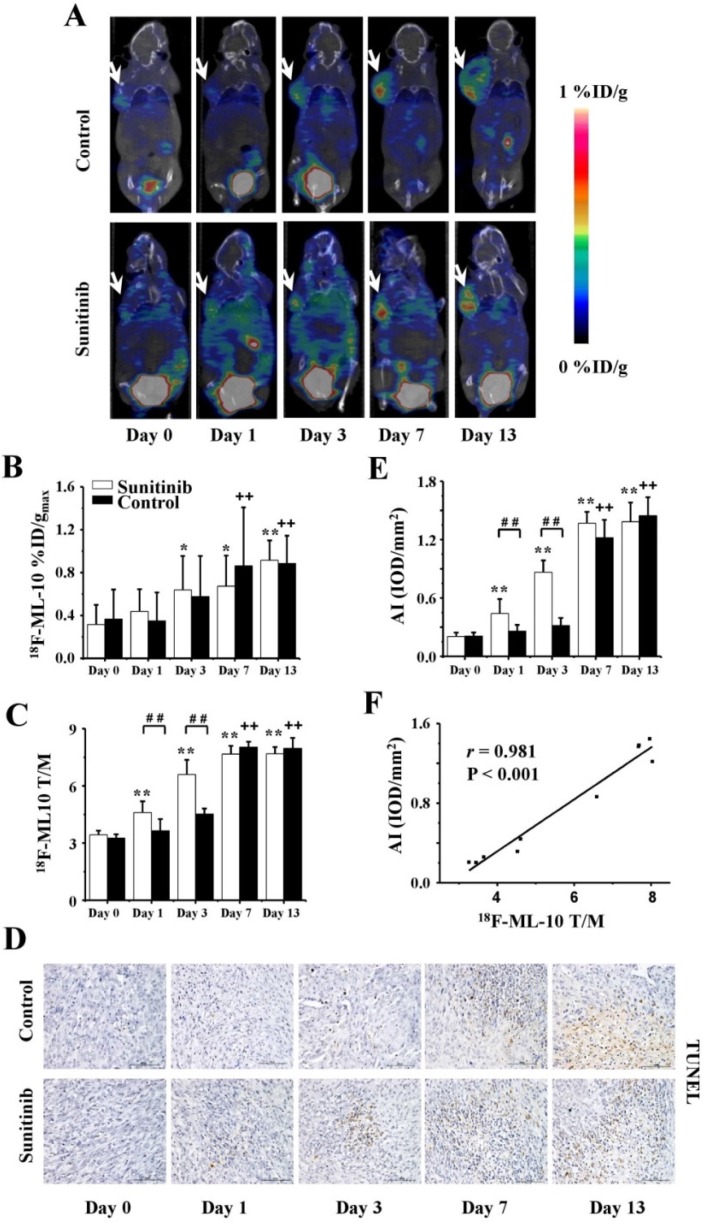
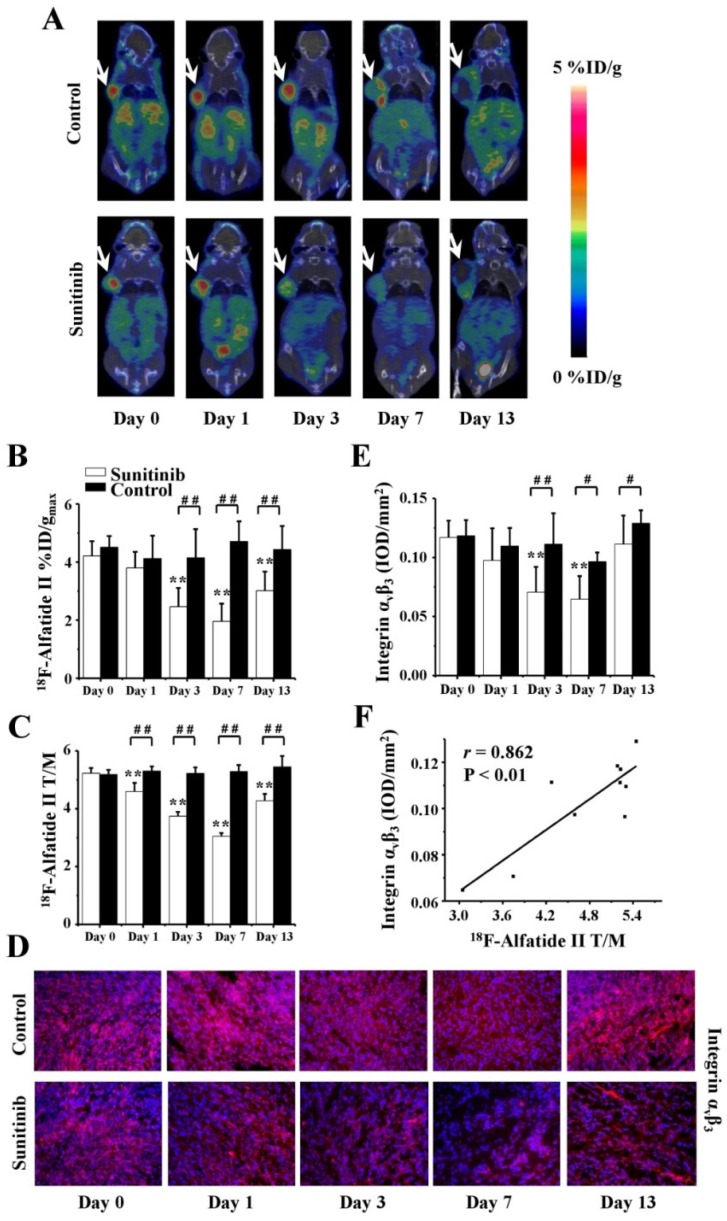
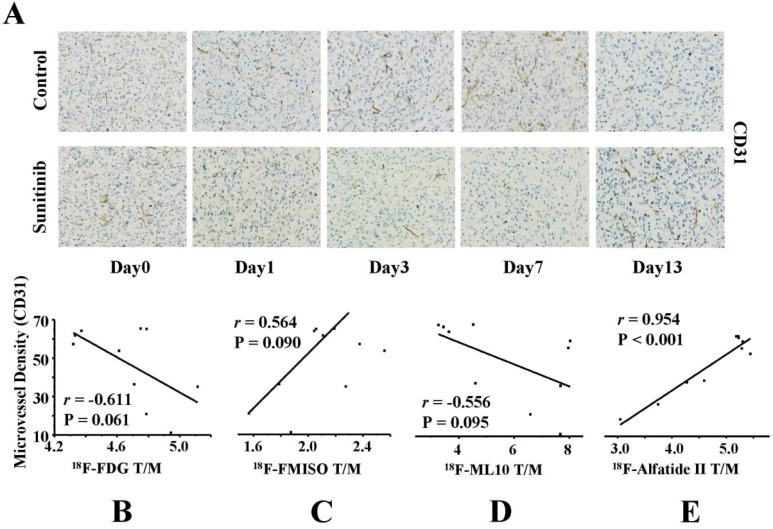
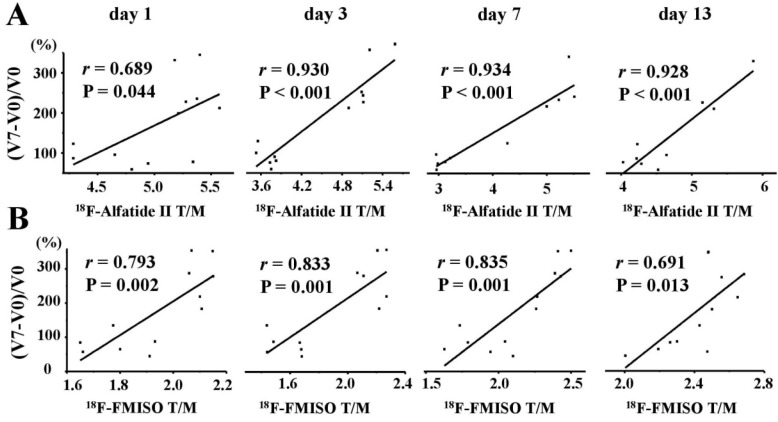
Objective: Antiangiogenesis therapy (AAT) has provided substantial benefits regarding improved outcomes and survival for suitable patients in clinical settings. Therefore, the early definition of therapeutic effects is urgently needed to guide cancer AAT. We aimed to optimize the early response monitoring and prediction of AAT efficacy, as indicated by the multi-targeted anti-angiogenic drug sunitinib in U87MG tumors, using noninvasive positron emission computed tomography (PET) molecular imaging strategies of multifactorial bioparameters. Methods: U87MG tumor mice were treated via intragastric injections of sunitinib (80 mg/kg) or vehicle for 7 consecutive days. Longitudinal MicroPET/CT scans with 18F-FDG, 18F-FMISO, 18F-ML-10 and 18F-Alfatide II were acquired to quantitatively measure metabolism, hypoxia, apoptosis and angiogenesis on days 0, 1, 3, 7 and 13 following therapy initiation. Tumor tissues from a dedicated group of mice were collected for immunohistochemical (IHC) analysis of key biomarkers (Glut-1, CA-IX, TUNEL, ανβ3 and CD31) at the time points of PET imaging. The tumor sizes and mouse weights were measured throughout the study. The tumor uptake (ID%/gmax), the ratios of the tumor/muscle (T/M) for each probe, and the tumor growth ratios (TGR) were calculated and used for statistical analyses of the differences and correlations. Results: Sunitinib successfully inhibited U87MG tumor growth with significant differences in the tumor size from day 9 after sunitinib treatment compared with the control group (P < 0.01). The uptakes of 18F-FMISO (reduced hypoxia), 18F-ML-10 (increased apoptosis) and 18F-Alfatide II (decreased angiogenesis) in the tumor lesions significantly changed during the early stage (days 1 to 3) of sunitinib treatment; however, the uptake of 18F-FDG (increased glucose metabolism) was significantly different during the late stage. The PET imaging data of each probe were all confirmed via ex vivo IHC of the relevant biomarkers. Notably, the PET imaging of 18F-Alfatide II and 18F-FMISO was significantly correlated (all P < 0.05) with TGR, whereas the imaging of 18F-FDG and 18F-ML-10 was not significantly correlated with TGR. Conclusion: Based on the tumor uptake of the PET probes and their correlations with MVD and TGR, 18F-Alfatide II PET may not only monitor the early response but also precisely predict the therapeutic efficacy of the multi-targeted, anti-angiogenic drug sunitinib in U87MG tumors. In conclusion, it is feasible to optimize the early response monitoring and efficacy prediction of cancer AAT using noninvasive PET molecular imaging strategies of multifactorial bioparameters, such as angiogenesis imaging with 18F-Alfatide II, which represents an RGD-based probe.
Keywords: 18F-ML-10; 18F-Alfatide II; 18F-FDG; 18F-FMISO; Antiangiogenesis therapy; Molecular imaging probe; PET; Sunitinib.; Therapy response.
Conflict of interest statement
The authors have declared that no competing interest exists.
Figures
Similar articles
-
Early monitoring antiangiogenesis treatment response of Sunitinib in U87MG Tumor Xenograft by (18)F-FLT MicroPET/CT imaging.Biomed Res Int. 2014;2014:218578. doi: 10.1155/2014/218578. Epub 2014 Apr 9. Biomed Res Int. 2014. PMID: 24860813 Free PMC article.
-
Monitoring therapeutic efficacy of sunitinib using [(18)F]FDG and [(18)F]FMISO PET in an immunocompetent model of luminal B (HER2-positive)-type mammary carcinoma.BMC Cancer. 2015 Jul 22;15:534. doi: 10.1186/s12885-015-1540-2. BMC Cancer. 2015. PMID: 26198000 Free PMC article.
-
Monitoring Sorafenib Resistance and Efficacy in Hepatocellular Carcinoma Using [18F]Alfatide II and [18F]Fluorodeoxyglucose Positron Emission Tomography.Mol Pharm. 2025 Apr 7;22(4):2088-2097. doi: 10.1021/acs.molpharmaceut.4c01218. Epub 2025 Feb 23. Mol Pharm. 2025. PMID: 39988972
-
Monitoring response to treatment in patients utilizing PET.Radiol Clin North Am. 2005 Jan;43(1):189-204. doi: 10.1016/j.rcl.2004.09.006. Radiol Clin North Am. 2005. PMID: 15693656 Review.
-
The Use of Novel PET Tracers to Image Breast Cancer Biologic Processes Such as Proliferation, DNA Damage and Repair, and Angiogenesis.J Nucl Med. 2016 Feb;57 Suppl 1:89S-95S. doi: 10.2967/jnumed.115.157958. J Nucl Med. 2016. PMID: 26834108 Review.
Cited by
-
Pretreatment PET/CT imaging of angiogenesis based on 18F-RGD tracer uptake may predict antiangiogenic response.Eur J Nucl Med Mol Imaging. 2019 Apr;46(4):940-947. doi: 10.1007/s00259-018-4143-8. Epub 2018 Sep 5. Eur J Nucl Med Mol Imaging. 2019. PMID: 30187104 Clinical Trial.
-
Development of Taccalonolide AJ-Hydroxypropyl-β-Cyclodextrin Inclusion Complexes for Treatment of Clear Cell Renal-Cell Carcinoma.Molecules. 2020 Nov 27;25(23):5586. doi: 10.3390/molecules25235586. Molecules. 2020. PMID: 33261151 Free PMC article.
-
A Comprehensive Review of Non-Covalent Radiofluorination Approaches Using Aluminum [18F]fluoride: Will [18F]AlF Replace 68Ga for Metal Chelate Labeling?Molecules. 2019 Aug 7;24(16):2866. doi: 10.3390/molecules24162866. Molecules. 2019. PMID: 31394799 Free PMC article. Review.
-
Oncologic Applications of Long Axial Field-of-View PET/Computed Tomography.PET Clin. 2021 Jan;16(1):65-73. doi: 10.1016/j.cpet.2020.09.010. PET Clin. 2021. PMID: 33218605 Free PMC article. Review.
-
Anterior gradient 2 as a supervisory marker for tumor vessel normalization induced by anti-angiogenic treatment.Oncol Lett. 2018 Sep;16(3):3083-3091. doi: 10.3892/ol.2018.8996. Epub 2018 Jun 20. Oncol Lett. 2018. PMID: 30127899 Free PMC article.
References
-
- Weis SM, Cheresh DA. Tumor angiogenesis: molecular pathways and therapeutic targets. Nat Med. 2011;17:1359–70. - PubMed
-
- Abdollahi A, Folkman J. Evading tumor evasion: current concepts and perspectives of anti-angiogenic cancer therapy. Drug Resist Updat. 2010;13:16–28. - PubMed
-
- Sessa C, Guibal A, Del CG, Ruegg C. Biomarkers of angiogenesis for the development of antiangiogenic therapies in oncology: tools or decorations? Nat Clin Pract Oncol. 2008;5:378–91. - PubMed
-
- Palmer DH. Sorafenib in advanced hepatocellular carcinoma. N Engl J Med. 2008;359:2498–9. - PubMed
Publication types
MeSH terms
Substances
LinkOut - more resources
Full Text Sources
Other Literature Sources
Research Materials
Miscellaneous
