

A New Concept of Enhancing Immuno-Chemotherapeutic Effects Against B16F10 Tumor via Systemic Administration by Taking Advantages of the Limitation of EPR Effect
- PMID: 27698946
- PMCID: PMC5039686
- DOI: 10.7150/thno.16184
A New Concept of Enhancing Immuno-Chemotherapeutic Effects Against B16F10 Tumor via Systemic Administration by Taking Advantages of the Limitation of EPR Effect
Abstract
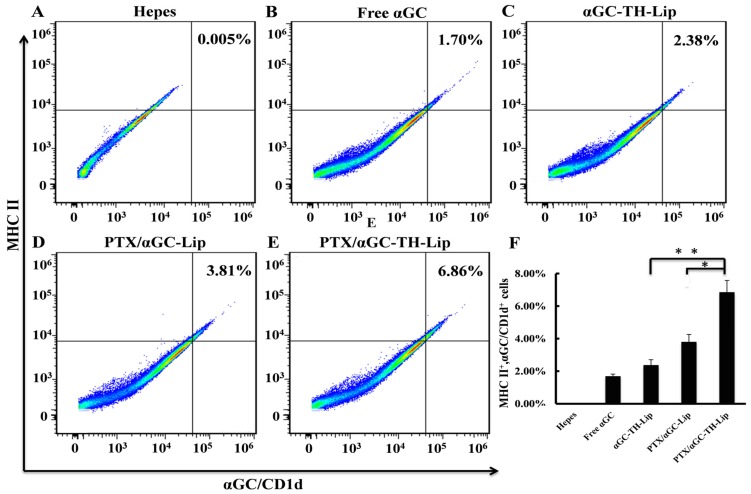
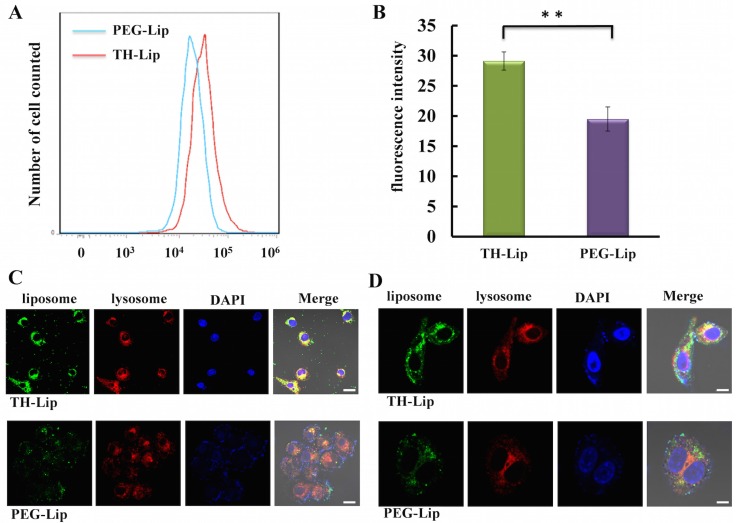
The enhanced permeability and retention (EPR) effect has been comfortably accepted, and extensively assumed as a keystone in the research on tumor-targeted drug delivery system. Due to the unsatisfied tumor-targeting efficiency of EPR effect being one conspicuous drawback, nanocarriers that merely relying on EPR effect are difficult to access the tumor tissue and consequently trigger efficient tumor therapy in clinic. In the present contribution, we break up the shackles of EPR effect on nanocarriers thanks to their universal distribution characteristic. We successfully design a paclitaxel (PTX) and alpha-galactosylceramide (αGC) co-loaded TH peptide (AGYLLGHINLHHLAHL(Aib)HHIL-Cys) -modified liposome (PTX/αGC-TH-Lip) and introduce a new concept of immuno-chemotherapy combination via accumulation of these liposomes at both spleen and tumor sites naturally and simultaneously. The PTX-initiated cytotoxicity attacks tumor cells at tumor sites, meanwhile, the αGC-triggered antitumor immune response emerges at spleen tissue. Different to the case that liposomes are loaded with sole drug, in this concept two therapeutic processes effectively reinforce each other, thereby elevating the tumor therapy efficiency significantly. The data demonstrates that the PTX/αGC-TH-Lip not only possess therapeutic effect against highly malignant B16F10 melanoma tumor, but also adjust the in vivo immune status and induce a more remarkable systemic antitumor immunity that could further suppress the growth of tumor at distant site. This work exhibits the capability of the PTX/αGC-TH-Lip in improving immune-chemotherapy against tumor after systemic administration.
Keywords: Alpha-galactosylceramide; Cancer immune-chemotherapy.; Distribution characteristic; Liposome; Paclitaxel.
Conflict of interest statement
The authors have declared that no competing interest exists.
Figures


Similar articles
-
The nanoparticulation by octaarginine-modified liposome improves α-galactosylceramide-mediated antitumor therapy via systemic administration.J Control Release. 2013 Oct 28;171(2):216-24. doi: 10.1016/j.jconrel.2013.07.004. Epub 2013 Jul 13. J Control Release. 2013. PMID: 23860186
-
A pH-responsive cell-penetrating peptide-modified liposomes with active recognizing of integrin αvβ3 for the treatment of melanoma.J Control Release. 2015 Nov 10;217:138-50. doi: 10.1016/j.jconrel.2015.09.009. Epub 2015 Sep 12. J Control Release. 2015. PMID: 26368312
-
Improved tumor-targeting drug delivery and therapeutic efficacy by cationic liposome modified with truncated bFGF peptide.J Control Release. 2010 Jul 1;145(1):17-25. doi: 10.1016/j.jconrel.2010.03.007. Epub 2010 Mar 20. J Control Release. 2010. PMID: 20307599
-
A review on liposome-based therapeutic approaches against malignant melanoma.Int J Pharm. 2021 Apr 15;599:120413. doi: 10.1016/j.ijpharm.2021.120413. Epub 2021 Mar 2. Int J Pharm. 2021. PMID: 33667562 Review.
-
Application of sterylglucoside-containing particles for drug delivery.Curr Pharm Biotechnol. 2005 Feb;6(1):81-93. doi: 10.2174/1389201053167194. Curr Pharm Biotechnol. 2005. PMID: 15727558 Review.
Cited by
-
Tumor-Targeted Chemoimmunotherapy with Immune-Checkpoint Blockade for Enhanced Anti-Melanoma Efficacy.AAPS J. 2019 Jan 11;21(2):18. doi: 10.1208/s12248-018-0289-3. AAPS J. 2019. PMID: 30635795
-
Lipid-based nanocarriers in combination chemotherapy: a promising strategy for advanced skin cancer management.Naunyn Schmiedebergs Arch Pharmacol. 2025 Jul 15. doi: 10.1007/s00210-025-04431-1. Online ahead of print. Naunyn Schmiedebergs Arch Pharmacol. 2025. PMID: 40663156 Review.
-
Colloidal Assemblies Composed of Polymeric Micellar/Emulsified Systems Integrate Cancer Therapy Combining a Tumor-Associated Antigen Vaccine and Chemotherapeutic Regimens.Nanomaterials (Basel). 2021 Jul 16;11(7):1844. doi: 10.3390/nano11071844. Nanomaterials (Basel). 2021. PMID: 34361230 Free PMC article.
-
Design of DOX-GNRs-PNIPAM@PEG-PLA Micelle With Temperature and Light Dual-Function for Potent Melanoma Therapy.Front Chem. 2021 Jan 5;8:599740. doi: 10.3389/fchem.2020.599740. eCollection 2020. Front Chem. 2021. PMID: 33469525 Free PMC article.
-
When Natural Compounds Meet Nanotechnology: Nature-Inspired Nanomedicines for Cancer Immunotherapy.Pharmaceutics. 2022 Jul 30;14(8):1589. doi: 10.3390/pharmaceutics14081589. Pharmaceutics. 2022. PMID: 36015215 Free PMC article. Review.
References
-
- Siegel R, Naishadham D, Jemal A. Cancer statistics, 2013. CA Cancer J Clin. 2013;63:11–30. - PubMed
-
- Ferrari M. Cancer nanotechnology: opportunities and challenges. Nat Rev Cancer. 2005;5:161–171. - PubMed
-
- Park K. Questions on the role of the EPR effect in tumor targeting. J Control Release. 2013;172:391. - PubMed
Publication types
MeSH terms
Substances
LinkOut - more resources
Full Text Sources
Other Literature Sources
Medical
