. 2016 Aug 24;7(9):3610-3630.
doi: 10.1364/BOE.7.003610. eCollection 2016 Sep 1.

Chemotherapeutic drug-specific alteration of microvascular blood flow in murine breast cancer as measured by diffuse correlation spectroscopy

Affiliations

Chemotherapeutic drug-specific alteration of microvascular blood flow in murine breast cancer as measured by diffuse correlation spectroscopy

Gabriel Ramirez et al. Biomed Opt Express. .

Abstract

The non-invasive, in vivo measurement of microvascular blood flow has the potential to enhance breast cancer therapy monitoring. Here, longitudinal blood flow of 4T1 murine breast cancer (N=125) under chemotherapy was quantified with diffuse correlation spectroscopy based on layer models. Six different treatment regimens involving doxorubicin, cyclophosphamide, and paclitaxel at clinically relevant doses were investigated. Treatments with cyclophosphamide increased blood flow as early as 3 days after administration, whereas paclitaxel induced a transient blood flow decrease at 1 day after administration. Early blood flow changes correlated strongly with the treatment outcome and distinguished treated from untreated mice individually for effective treatments.

Keywords: (170.3660) Light propagation in tissues; (170.6480) Spectroscopy, speckle; (290.4210) Multiple scattering.


Figures

Fig. 1
Fig. 1
Diagram of diffuse correlation spectroscopy and probe placement on a murine breast tumor in the mammary fat-pad. After the mouse was anesthetized with isoflurane, a custom-made probe was placed on the center of the tumor. A micromanipulator and a linear translational stage attached to the probe were utilized to enable placement of the probe on the same location within the tumor each day. A multi-mode optical fiber in the probe delivered near-infrared light from a 785 nm long coherence laser to the tumor surface. Light signals detected at four single-mode optical fibers placed 2.55, 2.89, 3.25 and 3.94 mm away from the source fiber were relayed to photon-counting avalanche photodiodes (APDs). Normalized temporal intensity autocorrelation functions of the detected light were calculated by an autocorrelator board and passed onto the computer.
Fig. 2
Fig. 2
Schematic of (a) a homogeneous semi-infinite medium (one-layer model), and (b) a semi-infinite two-layer medium (two-layer model) with a source (S) and four detectors (D) on the tissue surface (z = 0).
Fig. 3
Fig. 3
Example of in vivo DCS data from a mouse tumor in the control group at different time points and varying quality of fits. Black circle is the measured data and the red line is the fitted curve from multi-distance fitting of the analytic solution to different layer models. Only data from source-detector separations 2.5 and 3.9 mm are shown for clarity. The quality of one-layer model fit is good for (a) DCS measurements at day 0 (BFI = 1.38 × 10⁻⁸ cm2/s), but poor for (b) DCS measurements at day 11 (BFI = 2.03 × 10⁻⁹ cm2/s). Two-layer model provides a good fit for (c) DCS measurements at day 11 (BFI1 = 3.34 × 10⁻¹⁰ cm2/s, BFI2 = 9.21 × 10⁻⁹ cm2/s with L = 0.17 cm). S: source, D: detector.
Fig. 4
Fig. 4
Flow chart for hybrid algorithm based on layer models to separate the effect of scab on tumor blood flow quantification.
Fig. 5
Fig. 5
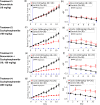
Group-averaged temporal changes in relative tumor area, rTA (left column) and relative blood flow, rBF (right column) are compared between the control group (filled black circle, solid line) and the treatment group (red star, dotted line). N refers to the number of animals per group. Error bars are derived from the standard error of the mean of each group at each measurement time point. Blue vertical line indicates the time when treatment drug or control vehicle was injected. Blue star indicates statistically significant difference between each treatment and control group based on two-sample test (p < 0.05).
Fig. 6
Fig. 6
Group-averaged temporal changes in relative tumor area, rTA (left column) and relative blood flow, rBF (right column) are compared between the control group (filled black circle, solid line) and the treatment group (red star, dotted line). Top and bottom figures are from the group with 40 mg/kg paclitaxel (Taxol) and from the group with 60 mg/kg paclitaxel treatment, respectively. N refers to the number of animals per group. Error bars are derived from the standard error of the mean of each group at each measurement time point. Blue vertical line indicates the time when treatment drug or control vehicle was injected. Blue star indicates statistically significant difference between each treatment and control group based on two-sample test (p < 0.05).
Fig. 7
Fig. 7
Correlation between treatment outcome (rTA at Day 11) and rBF at (a) Day 3 or (b) Day 7.
Fig. 8
Fig. 8
(a) ROC curve for distinguishing group with AC combination therapy and control group based on rBF at day 3 and 7. (b) ROC curve for distinguishing group with cyclophosphamide 200 mg/kg and control group based on rBF at day 3 and 7.
Fig. 9
Fig. 9
Group-averaged temporal changes in L from mice in the control group which yielded two-layer model fit. Error bars are derived from the standard error of the mean at each time point.

References

    1. Rastogi P., Anderson S. J., Bear H. D., Geyer C. E., Kahlenberg M. S., Robidoux A., Margolese R. G., Hoehn J. L., Vogel V. G., Dakhil S. R., Tamkus D., King K. M., Pajon E. R., Wright M. J., Robert J., Paik S., Mamounas E. P., Wolmark N., “Preoperative chemotherapy: updates of National Surgical Adjuvant Breast and Bowel Project Protocols B-18 and B-27,” J. Clin. Onc. 26, 778–785 (2008).10.1200/JCO.2007.15.0235 - DOI - PubMed
    1. Caudle A. S., Gonzalez-Angulo A. M., Hunt K. K., Liu P., Pusztai L., Symmans W. F., Kuerer H. M., Mittendorf E. A., Hortobagyi G. N., Meric-Bernstam F., “Predictors of tumor progression during neoadjuvant chemotherapy in breast cancer,” J. Clin. Onc. 28, 1821–1828 (2010).10.1200/JCO.2009.25.3286 - DOI - PMC - PubMed
    1. Yeh E., Slanetz P., Kopans D. B., Rafferty E., Georgian-Smith D., Moy L., Halpern E., Moore R., Kuter I., Taghian A., “Prospective comparison of mammography, sonography, and MRI in patients undergoing neoadjuvant chemotherapy for palpable breast cancer,” Am. J. Roentgenol. 184, 868–877 (2005).10.2214/ajr.184.3.01840868 - DOI - PubMed
    1. Choe R., Durduran T., “Diffuse optical monitoring of the neoadjuvant breast cancer therapy,” IEEE J. Sel. Top. Quantum Electron. 18, 1367–1386 (2012).10.1109/JSTQE.2011.2177963 - DOI - PMC - PubMed
    1. Beresford M., Padhani A. R., Goh V., Makris A., “Imaging breast cancer response during neoadjuvant systemic therapy,” Expert Rev. Anticancer Ther. 5, 893–905 (2005).10.1586/14737140.5.5.893 - DOI - PubMed

LinkOut - more resources