. 2016 Aug 24;7(9):3643-3658.
doi: 10.1364/BOE.7.003643. eCollection 2016 Sep 1.

Preclinical photoacoustic models: application for ultrasensitive single cell malaria diagnosis in large vein and artery

Affiliations

Preclinical photoacoustic models: application for ultrasensitive single cell malaria diagnosis in large vein and artery

Yulian A Menyaev et al. Biomed Opt Express. .

Abstract

In vivo photoacoustic flow cytometry (PAFC) has demonstrated potential for early diagnosis of deadly diseases through detection of rare circulating tumor cells, pathogens, and clots in nearly the entire blood volume. Before clinical application, this promising diagnostic platform requires verification and optimization using adequate preclinical models. We show here that this can be addressed by examination of large mouse blood vessels which are similar in size, depth and flow velocity to human vessels used in PAFC. Using this model, we verified the capability of PAFC for ultrasensitive, noninvasive, label-free, rapid malaria diagnosis. The time-resolved detection of delayed PA signals from deep vessels provided complete elimination of background from strongly pigmented skin. We discovered that PAFC's sensitivity is higher during examination of infected cells in arteries compared to veins at similar flow rate. Our advanced PAFC platform integrating a 1060 nm laser with tunable pulse rate and width, a wearable probe with a focused transducer, and linear and nonlinear nanobubble-amplified signal processing demonstrated detection of parasitemia at the unprecedented level of 0.00000001% within 20 seconds and the potential to further improve the sensitivity 100-fold in humans, that is approximately 106 times better than in existing malaria tests.

Keywords: (110.5125) Photoacoustics; (330.6130) Spatial resolution.


Figures
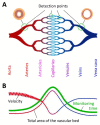
Fig. 1
Fig. 1
(A) Schematic of blood circulatory system and PAFC detection points. The insets show the differences in the artery (left) and vein (right) associated with larger vessel wall thickness and smaller diameter of the lumen (internal space) in the artery. (B) Flow velocity, total internal area of vessels of this type, and monitoring time (“circulation cycle”) in small and large vessels.
Fig. 2
Fig. 2
Detection points in human (left) and rodent (right) for wearable PAFC devices. Top (from left): human ear [21], ventral surface of human wrist with wearable PAFC [3,4], and mouse ear [21]. Middle: wearable (human hand-worn) PAFC [6], and mouse neck area with JV. Bottom: ultrasound images of human vein in dorsal area (left) and mouse JV (right).
Fig. 3
Fig. 3
Absorption spectra of hemozoin [17,18], melanin [4], magnetic beads [3], arterial (oxygenation ~96%) and venous (oxygenation ~70%) blood [18]. Similarity in absorption spectra of hemozoin and magnetic beads indicate a potential to use magnetic beads as hemozoin phantom for calibration of PAFC. Excitation (Ex) and emission (Em) spectra of green fluorescent protein (GFP) expressed by parasites used in the experiments [18]. Arrows indicate laser wavelengths used: 488 nm (for continuous wave fluorescence excitation), and 671 nm and 1060 nm (for pulsed generation of PA signals).
Fig. 4
Fig. 4
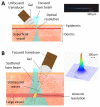
Principles of in vivo PAFC. (A) Schematic of OR-PAFC for examination of superficial microvessels. (B) Schematic of AR-PAFC for assessing deep large vessels. The insets illustrate examples of experimental estimation of optical (A) and acoustic (B) resolution. Laser parameters: beam shape, linear; beam size, 6.5 µm x 780 µm; wavelength, 1060 nm. Lateral resolution in B (~90 μm) of the spherical focused transducer is represented as a PA signal distribution from black tape scanned with a focused laser beam with diameter of 2 µm at 532 nm and 10 ns pulse width.
Fig. 5
Fig. 5
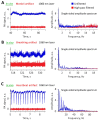
Artifacts and their removal in PAFC traces in mouse model. (A) Animal motions during anesthesia. (B) Breathing-related vessel motion. (C) Heartbeat-related artifacts in large arteries. Traces were filtered by a high-pass filter to eliminate low frequency artifacts. Cutoff frequency was 10 Hz (A,B) or 50 Hz (C). PA signal amplitudes and corresponding amplitude spectra of both unfiltered (blue) and filtered (red) traces are presented in left and right columns respectively.
Fig. 6
Fig. 6
PA and fluorescent signal traces from different vessels. (A) Time-resolved detection of PA signals from deep JV and CA coming to transducer with a delay compared to background PA signals from pigmented skin. (B) PA signal traces from uninfected mouse (top), JV (middle) and CA (bottom) in infected mice. (C) Fluorescence (top, FL) and PA (bottom) signal traces from ~70 µm ear vein of infected mice. (D) Fluorescence (top, FL) and PA (bottom) signal traces ~50 µm ear artery of infected mice.
Fig. 7
Fig. 7
In vivo monitoring of number of PA signals per minute (PA signal rate) from iRBCs for 41 days after infection for superficial (A) and deep blood vessels (B). (C) In vivo PA monitoring of PA signal rate from iRBC in superficial vessel with 1060 nm laser. (D) In vitro PA monitoring of PA signal rate from iRBC infected blood in a quartz flow tube for validation of in vivo data for arterial and venous blood samples. Laser parameters: (A) wavelength, 671 nm at energy fluence of 200 mJ/cm2; (B,C) wavelength, 1060 nm at energy fluence of 200 mJ/cm2.
Fig. 8
Fig. 8
PA signal traces for superficial ear artery (30-40 µm in diameter) and deep CA (~0.9 mm in diameter) at (A) the peak of infection (16th day of infection) and (B,C) at low parasitemia levels (32nd and 2nd day) at energy fluence of 200 mJ/cm2
Fig. 9
Fig. 9
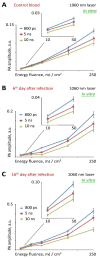
PA signal amplitudes in vitro as a function of energy fluence at wavelength 1060 nm for different pulse duration (800 ps, 5 ns, and 10 ns) for blood samples from control (uninfected) mice (A) and infected mice on 6th (B) and 16th day (C) after infection.

References

    1. Woo J., Baumann A., Arguello V., “Recent advancements of flow cytometry: new applications in hematology and oncology,” Expert Rev. Mol. Diagn. 14(1), 67–81 (2014).10.1586/14737159.2014.862153 - DOI - PubMed
    1. Tuchin V. V., Tárnok A., Zharov V. P., “In vivo flow cytometry: a horizon of opportunities,” Cytometry A 79(10), 737–745 (2011).10.1002/cyto.a.21143 - DOI - PMC - PubMed
    1. Galanzha E. I., Zharov V. P., “Photoacoustic flow cytometry,” Methods 57(3), 280–296 (2012).10.1016/j.ymeth.2012.06.009 - DOI - PMC - PubMed
    1. Galanzha E. I., Shashkov E. V., Spring P. M., Suen J. Y., Zharov V. P., “In vivo, noninvasive, label-free detection and eradication of circulating metastatic melanoma cells using two-color photoacoustic flow cytometry with a diode laser,” Cancer Res. 69(20), 7926–7934 (2009).10.1158/0008-5472.CAN-08-4900 - DOI - PMC - PubMed
    1. Sarimollaoglu M., Nedosekin D. A., Menyaev Y. A., Juratli M. A., Zharov V. P., “Nonlinear photoacoustic signal amplification from single targets in absorption background,” Photoacoustics 2(1), 1–11 (2014).10.1016/j.pacs.2013.11.002 - DOI - PMC - PubMed