. 2016 Sep 22;1(15):e86976.
doi: 10.1172/jci.insight.86976.

Tissue-specific metabolic reprogramming drives nutrient flux in diabetic complications

Affiliations

Tissue-specific metabolic reprogramming drives nutrient flux in diabetic complications

Kelli M Sas et al. JCI Insight. .

Abstract

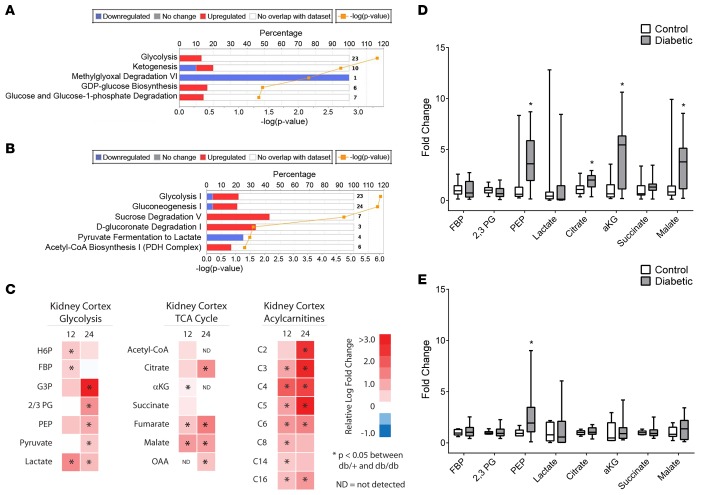
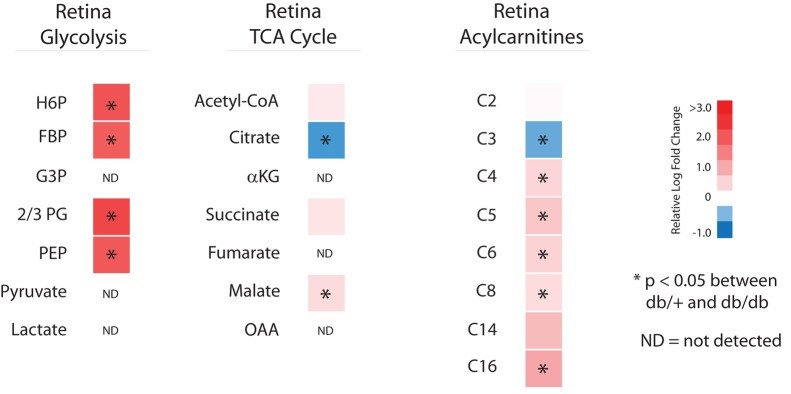
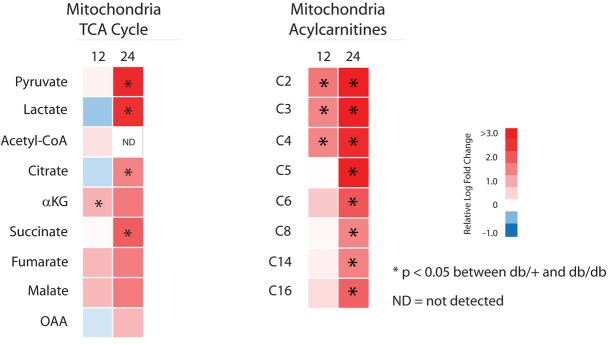
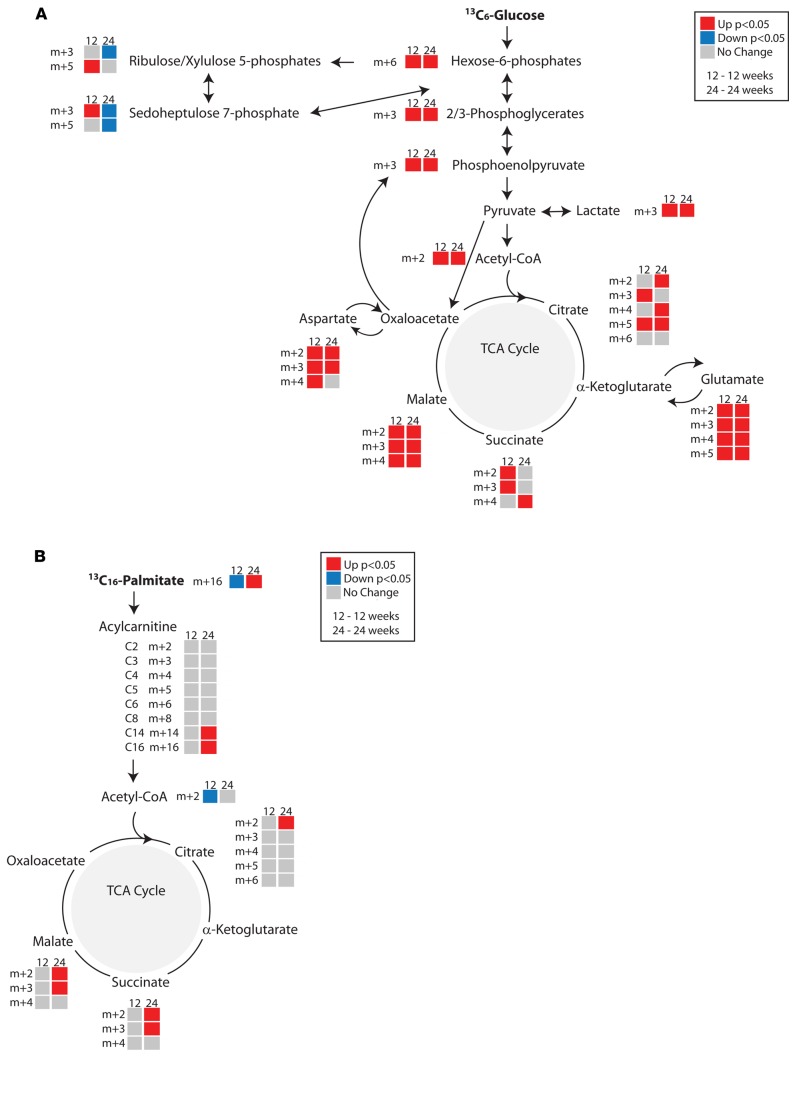
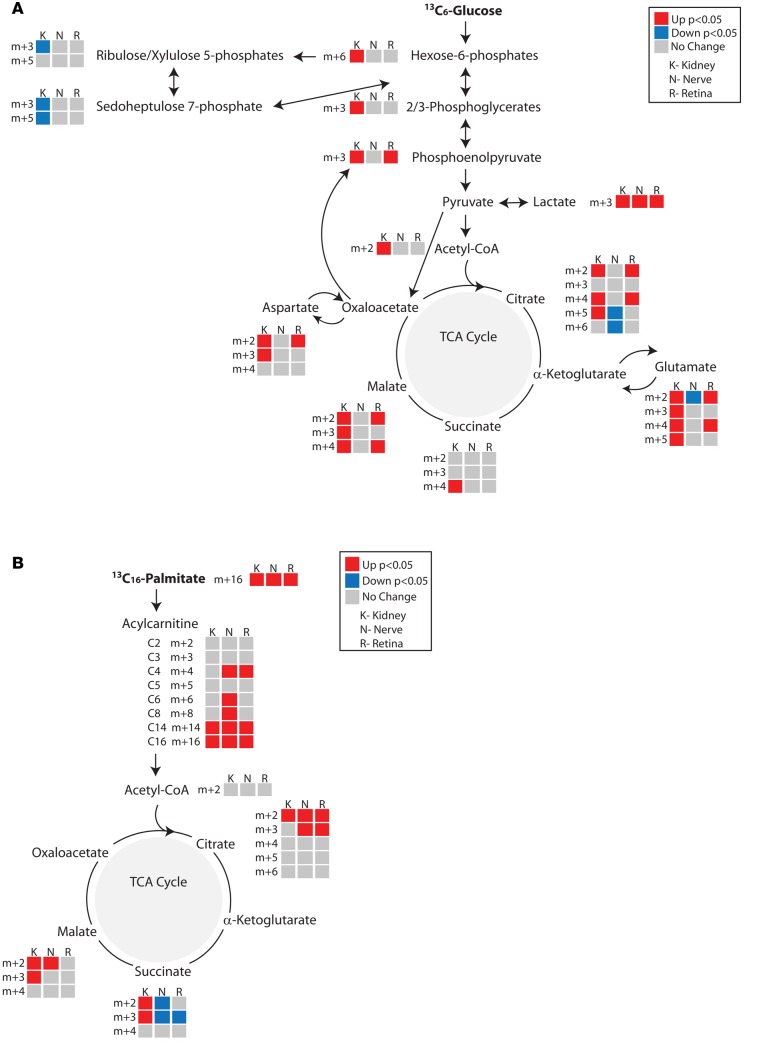
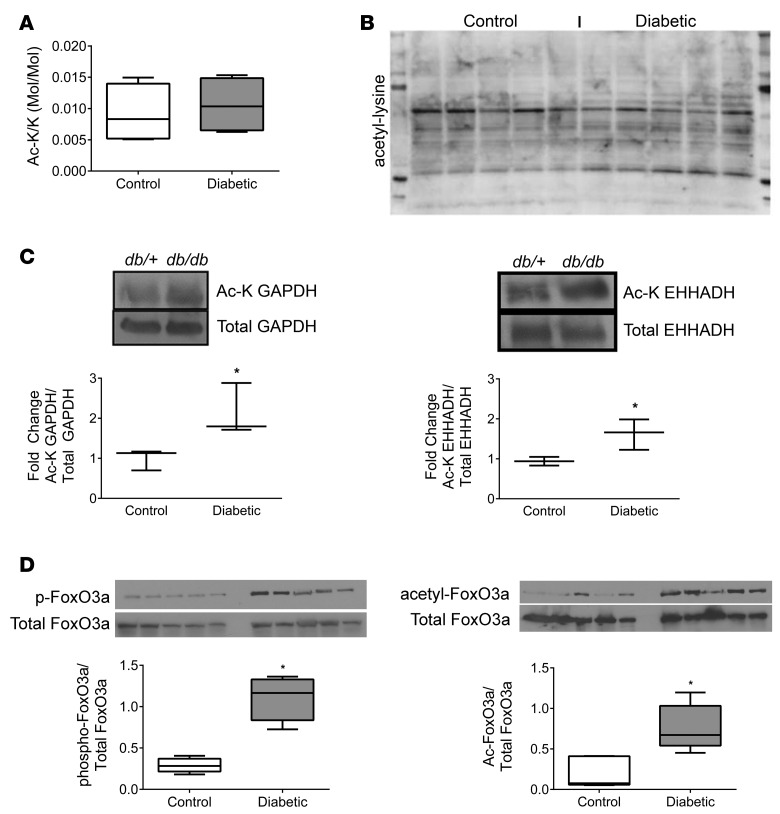
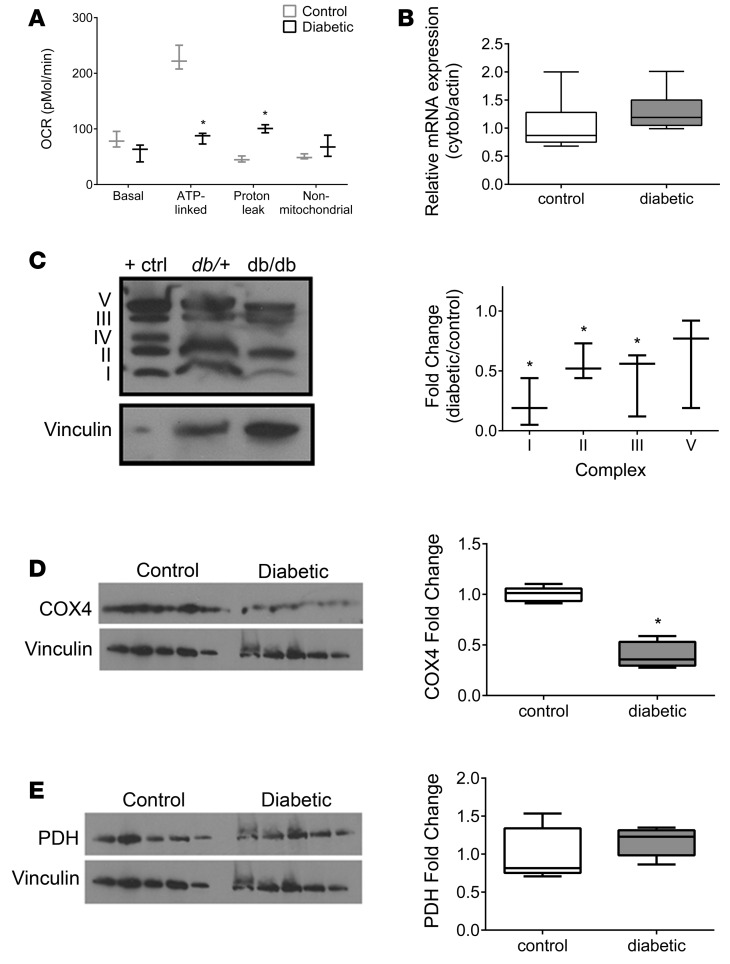
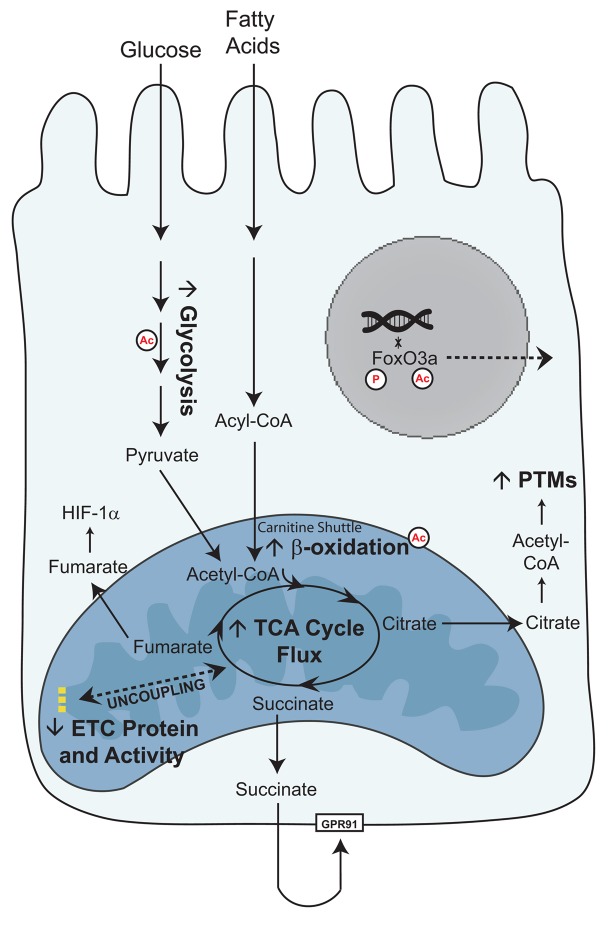
Diabetes is associated with altered cellular metabolism, but how altered metabolism contributes to the development of diabetic complications is unknown. We used the BKS db/db diabetic mouse model to investigate changes in carbohydrate and lipid metabolism in kidney cortex, peripheral nerve, and retina. A systems approach using transcriptomics, metabolomics, and metabolic flux analysis identified tissue-specific differences, with increased glucose and fatty acid metabolism in the kidney, a moderate increase in the retina, and a decrease in the nerve. In the kidney, increased metabolism was associated with enhanced protein acetylation and mitochondrial dysfunction. To confirm these findings in human disease, we analyzed diabetic kidney transcriptomic data and urinary metabolites from a cohort of Southwestern American Indians. The urinary findings were replicated in 2 independent patient cohorts, the Finnish Diabetic Nephropathy and the Family Investigation of Nephropathy and Diabetes studies. Increased concentrations of TCA cycle metabolites in urine, but not in plasma, predicted progression of diabetic kidney disease, and there was an enrichment of pathways involved in glycolysis and fatty acid and amino acid metabolism. Our findings highlight tissue-specific changes in metabolism in complication-prone tissues in diabetes and suggest that urinary TCA cycle intermediates are potential prognostic biomarkers of diabetic kidney disease progression.


Figures

Figure 1
Figure 1. Transcriptomic and metabolomic analyses from control and diabetic mice.
(A and B) Predicted alteration of pathways involved in glucose metabolism in the (A) kidney cortex and (B) sciatic nerve in 24-week-old diabetic versus control mice, with the percentage of genes upregulated (red) and downregulated (blue) (P < 0.05 [–log(P value) > 1.3], kidney n = 5/group; nerve control n = 9, nerve diabetic n = 10). The number of transcripts in each pathway is shown at the right margin corresponding to each pathway. (C) Relative levels of glycolytic, TCA cycle, and acylcarnitine metabolites from kidney cortex of 12- and 24-week-old diabetic versus control mice are depicted as upregulated (red) or downregulated (blue) in diabetic mice (n = 12/group; ND, not detected above noise). (D and E) Levels of glycolytic and TCA cycle metabolites in urine from (D) 12- and (E) 24-week-old control and diabetic mice (n = 5/group). *P < 0.05, Student’s 2-tailed t test.
Figure 2
Figure 2. Metabolomics analysis of retina from control and diabetic mice.
Relative levels of glycolytic, TCA cycle, and acylcarnitine metabolites from retina of 24-week-old diabetic versus control mice are depicted as upregulated (red) or downregulated (blue) in diabetic mice (n = 10/group; ND, not detected above noise). *P < 0.05, Student’s 2-tailed t test.
Figure 3
Figure 3. Mitochondrial metabolism from kidney cortex of control and diabetic mice.
Relative mitochondrial levels of TCA cycle and acylcarnitine metabolites from kidney cortex of 12- and 24-week-old diabetic versus control mice are depicted as upregulated (red) or downregulated (blue) in diabetic mice (n = 10/group; ND, not detected above noise). *P < 0.05, Student’s 2-tailed t test.
Figure 4
Figure 4. In vivo metabolic flux analyses in the kidney cortex of control and diabetic mice.
Metabolic flux was determined from (A) [13C6]glucose (n = 8/group) or (B) [13C16]K palmitate (12 week, n = 6/group; 24 week, control n = 5, diabetic n = 8). Metabolites in the diabetic kidney cortex from 12- and 24-week-old mice are depicted as upregulated (red), downregulated (blue), or unchanged (gray) compared with control kidney cortex. Upon entry into the TCA cycle through acetyl-CoA, each TCA cycle metabolite incorporates 2 13C labels (m+2). Metabolites resulting from a second turn of the TCA cycle would incorporate 2 (citrate, m+4) or 1 (all other intermediates, m+3) additional 13C labels. If labeled pyruvate enters the TCA cycle through oxaloacetate, it will contribute 3 or 5 13C labels (m+3 or m+5) to citrate during condensation with unlabeled or labeled acetyl-CoA, respectively. *P < 0.05, Student’s 2-tailed t test.
Figure 5
Figure 5. Comparative in vivo metabolic flux analyses in the kidney cortex, sciatic nerve, and retina of 24-week-old control and diabetic mice.
Metabolic flux was determined from (A) [13C6]glucose (n = 8/group) or (B) [13C16]K palmitate (control n = 5, diabetic n = 8). Metabolites in the diabetic tissues from 24-week-old mice are depicted as upregulated (red), downregulated (blue) or unchanged (gray) compared with control tissues. Upon entry into the TCA cycle through acetyl-CoA, each TCA cycle metabolite incorporates 2 13C labels (m+2). Metabolites resulting from a second turn of the TCA cycle would incorporate 2 (citrate, m+4) or 1 (all other intermediates, m+3) additional 13C labels. If labeled pyruvate enters the TCA cycle through oxaloacetate, it will contribute 3 or 5 13C labels (m+3 or m+5) to citrate during condensation with unlabeled or labeled acetyl-CoA, respectively. *P < 0.05, Student’s 2-tailed t test.
Figure 6
Figure 6. Acetylation in the kidney cortex of 24-week-old control and diabetic mice.
Total lysine acetylation was determined by (A) LC/MS and (B) Western blot of kidney cortex lysates from 24-week-old control (db/+) and diabetic (db/db) mice (n = 5/group). (C) Relative acetylation of GAPDH and enoyl-CoA-hydratase/3-hydroxyacyl-CoA dehydrogenase (EHHADH), enzymes involved in glycolysis and β-oxidation, respectively, were determined (n = 3/group). (D) Relative phosphorylation and acetylation of FoxO3a (n = 3/group). *P < 0.05, Student’s 2-tailed t test.
Figure 7
Figure 7. Mitochondrial electron transport chain complex function and expression in the kidney cortex of 24-week-old control and diabetic mice.
(A) Oxygen consumption rate (OCR) was determined in mitochondria isolated from kidney cortex of 24-week-old control and diabetic mice to determine function through electron transport chain (ETC) complex I (n = 3/group). (B) Mitochondrial DNA copy number was determined by qPCR for cytochrome b normalized to actin (n = 7/group). Protein expression of (C) ETC complexes I, II, III, and V (n = 3), (D) cytochrome oxidase 4 (COX4), a subunit of complex IV (n = 5/group), and (E) pyruvate dehydrogenase (PDH) (n = 5/group) were normalized to vinculin. (D and E) The COX4 blot was reprobed for PDH; therefore, the same vinculin control is presented. *P < 0.05, Student’s 2-tailed t test.
Figure 8
Figure 8. Metabolomic analysis of urines from diabetic and control subjects.
(A and B) Levels of glycolytic and TCA cycle metabolites in urine from diabetic subjects from the (A) Southwestern American Indian cohort (n = 26) or (B) FinnDiane study (n = 72) compared with control subjects (n = 28) enrolled in the FinnDiane study. *P < 0.05, Student’s 2-tailed t test. (C and D) Levels of (C) glycolytic and (D) TCA cycle metabolites in baseline urine from control, diabetic resistor, and diabetic progressor subjects enrolled in the FIND study (n = 10/group). *P ≤ 0.05 versus controls; °P ≤ 0.05 versus controls and resistors, 1-way ANOVA with Tukey’s multiple comparisons.
Figure 9
Figure 9. Schema of glucose and fatty acid metabolism in the diabetic proximal tubule cell.
As the glucose concentration in plasma or urine increases, more glucose is transported into kidney proximal tubule cells. Glycolysis increases, resulting in increased pyruvate levels and TCA cycle activity in the mitochondria. Fatty acids are broken down into acyl-CoAs and transported across the mitochondrial membrane as acylcarnitines. β-Oxidation increases, resulting in increased TCA cycle activity. Although mitochondrial metabolism is elevated, there is a concurrent lack of increased ATP production through the electron transport chain (26). We propose that an uncoupling between mitochondrial metabolism and oxidative phosphorylation may underlie the metabolic phenotype of diabetic kidney disease. The increased TCA cycle metabolites can perturb normal cellular function. High levels of citrate can be used as a substrate for post-translational modifications (PTMs), such as acetylation (Ac), which can alter the activity of metabolic enzymes and localization of transcription factors. Succinate, through GPR91, can activate the renin-angiotensin system, and fumarate can induce HIF-1α. These perturbations can promote progression of DKD.

References

    1. Centers for Disease Control and Prevention. National diabetes fact sheet: national estimates and general information on diabetes and prediabetes in the United States, 2011. http://www.cdc.gov/diabetes/pubs/pdf/ndfs_2011.pdf Accessed September 3, 2016.
    1. Naresh Kumar R, Sundaram R, Shanthi P, Sachdanandam P. Protective role of 20-OH ecdysone on lipid profile and tissue fatty acid changes in streptozotocin induced diabetic rats. Eur J Pharmacol. 2013;698(1-3):489–498. doi: 10.1016/j.ejphar.2012.10.016. - DOI - PubMed
    1. Sundaram R, Shanthi P, Sachdanandam P. Effect of iridoid glucoside on plasma lipid profile, tissue fatty acid changes, inflammatory cytokines, and GLUT4 expression in skeletal muscle of streptozotocin-induced diabetic rats. Mol Cell Biochem. 2013;380(1-2):43–55. doi: 10.1007/s11010-013-1656-0. - DOI - PubMed
    1. Vallon V. The proximal tubule in the pathophysiology of the diabetic kidney. Am J Physiol Regul Integr Comp Physiol. 2011;300(5):R1009–R1022. doi: 10.1152/ajpregu.00809.2010. - DOI - PMC - PubMed
    1. Bonventre JV. Can we target tubular damage to prevent renal function decline in diabetes? Semin Nephrol. 2012;32(5):452–462. doi: 10.1016/j.semnephrol.2012.07.008. - DOI - PMC - PubMed

Publication types

MeSH terms