. 2016 Feb 25;1(2):e85311.
doi: 10.1172/jci.insight.85311.

Dynamic dual-isotope molecular imaging elucidates principles for optimizing intrathecal drug delivery

Affiliations

Dynamic dual-isotope molecular imaging elucidates principles for optimizing intrathecal drug delivery

Daniel A Wolf et al. JCI Insight. .

Abstract

The intrathecal (IT) dosing route offers a seemingly obvious solution for delivering drugs directly to the central nervous system. However, gaps in understanding drug molecule behavior within the anatomically and kinetically unique environment of the mammalian IT space have impeded the establishment of pharmacokinetic principles for optimizing regional drug exposure along the neuraxis. Here, we have utilized high-resolution single-photon emission tomography with X-ray computed tomography to study the behavior of multiple molecular imaging tracers following an IT bolus injection, with supporting histology, autoradiography, block-face tomography, and MRI. Using simultaneous dual-isotope imaging, we demonstrate that the regional CNS tissue exposure of molecules with varying chemical properties is affected by IT space anatomy, cerebrospinal fluid (CSF) dynamics, CSF clearance routes, and the location and volume of the injected bolus. These imaging approaches can be used across species to optimize the safety and efficacy of IT drug therapy for neurological disorders.


Figures

Figure 1
Figure 1. Imaging the intrathecal space by MRI reveals anatomy that closely mirrors that which can be identified using classical dye-imaging techniques.
(A) Sagittal high-resolution whole-body T2-weighted MRI image highlighting the intrathecal space along the rostrocaudal neuraxis of the rat (representative image from cohort of n = 6). (B) Focused MRI image of the head, outlining the cranial subarachnoid space in high detail, including major cerebrospinal fluid–containing (CSF-containing) cisterns and recesses (1, cisterna magna; 2, pituitary recess; 3, supracerebellar cistern; 4, olfactory cistern). (C) Sagittal cryosectioned head slice of a rat following lumbar puncture infusion of India ink (n = 1 experiment performed), emphasizing congruent intrathecal anatomy to that of CSF imaged by magnetic resonance (see Supplemental Video 1 for 3D reconstruction of serial sections). (D) Comparison of CSF volume measurement calculated from a 3D reconstruction of serial cryosections of a rat following lumbar intrathecal injection of India ink (n = 1) and by whole-body T2-weighted MRI (n = 1). (E) 3D rendering of the India ink, highlighting the intrathecal space within the cervical spinal column and cranium. Note the pockets of CSF branching out along cervical nerve roots, running along the ventral aspects of the brain and along lateral aspects of the supracerebellar and olfactory cisterns as well as the middle cerebral artery. (F) Sagittal whole-body cryosection of a rat following lumbar intrathecal injection of Evans blue dye (representative image from n = 2 experiments performed). (G) Cross-sectional views of the Evans blue dye–filled intrathecal space at different levels of the spinal column, as rendered from a 3D reconstruction made from serial sagittal cryosections, as in E (see Supplemental Video 2 for fly-through view of the 3D reconstruction). Note the rostral to caudal gradient of ink within the intrathecal space as well as exchange into the spinal cord interstitial fluid. Original magnification, ×1 (A and F); ×1.5 (B, C, and E); and x4 (G).
Figure 2
Figure 2. Noninvasive single-photon emission tomography with X-ray computed tomography imaging can be used to quantitatively track the biodistribution of molecules within the intrathecal space with high resolution.
(A) High-resolution single-photon emission tomography with X-ray computed tomography (SPECT-CT) imaging of a rat (representative from a cohort of n = 5) 6 hours after lumbar injection of 50 μl of 123I-labeled human serum albumin (123I-HSA), showing radiotracer accumulation within cerebrospinal fluid–containing (CSF-containing) lacunes in the intrathecal space along the neuraxis, most notably adjacent to the lumbar nerve roots. (B) Quantification of radiotracer concentration along the neuraxis, within the spinal intrathecal space region of interest (ROI) from the animal shown in A. Peaks and troughs correspond to CSF pockets along anatomical nerve routes between vertebrae (anatomical locations labeled along the plots). (C) High-resolution SPECT-CT sagittal head images of 123I-HSA following a 50-μl lumbar intrathecal injection of the radiotracer (representative images from a cohort of n = 5) revealed faster kinetics of solute transport through the CSF along the ventral rather than the dorsal surface of the brain. 2 hours after injection, the tracer had flowed rostrally along the ventral surface of the brain, through the pituitary recess and toward the olfactory cisterns as well as laterally along and into the supracerebellar cistern. Later, at 6 hours after injection, the tracer appeared along the medial interhemispheric fissure of the dorsal surface of the cerebral cortex (arrow). (D) 6 hours after injection of a 50-μl bolus of 123I-HSA, tracer accumulation was observed across the cribriform plate in the nasal lymphatics and had accumulated within cervical lymph nodes (arrows). (E) Intrathecal injection of the small-molecule 111In-diethylenetriamine-pentacetic acid (111In-DTPA) (representative image from a cohort of n = 5) resulted in a similar pattern of distribution in the cranial intrathecal space 2 hours after injection. (F) Autoradiogram of a slice through the transverse plane of the head of a rat 2 hours after lumbar infusion of 111In-DTPA (n = 1 experiment performed) depicts outflow of the imaging agent from the CSF into the nasal lymphatics (arrow). (G) A 3D model of the main routes of molecule movement through the cranial CSF constructed from multiple SPECT-CT scans of lumbar intrathecally administered 123I-HSA 6 hours after injection. (blue = routes of molecule trafficking, light brown = brain parenchyma). Original magnification, ×0.5 (C); ×0.75 (DF); and ×1 (G).
Figure 3
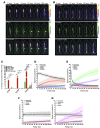
Figure 3. Molecular weight and protein-binding affinity affect both the distribution and retention of molecules within the intrathecal space.
(A and B) Simultaneous dynamic dual imaging of (A) 123I-labeled human serum albumin (123I-HSA) and pertechnetate (99mTcO4) (representative data shown from 1 animal of a cohort of n = 4) and (B) 99mTc-dimercaptosuccinic acid (99mTc-DMSA) and 111In-diethylenetriamine-pentacetic acid (111In-DTPA) (representative data shown from 1 animal of a cohort of n = 4) using planar scintigraphy following injection of a mixture of the two molecules. Snapshot images were created from 1-minute-long scanning windows at 2, 5, 10, 30, and 60 minutes and a 10-minute-long scanning window 120 minutes after injection. (C) Protein binding of 99mTcO4, 99mTc-DMSA, 99mTc-DTPA, 111In-DTPA, and 99mTc-sestamibi to rat cerebrospinal fluid (CSF) (rCSF), human CSF (hCSF), and HSA. Each experiment was performed in triplicate, and data are depicted as the mean ± SD. *P < 0.05, **P < 0.01, ***P < 0.001, ****P < 0.0001, 1-way ANOVA followed by Tukey’s multiple comparisons test. (DG) Quantitative analysis of the planar scintigraphy data presented in A and B represented as time-activity curves, depicting the detectable radioactive counts from (D) 125I-HSA, (E) 99mTcO4, (F) 99mTc-DMSA, and (G) 111In-DTPA within the chosen regions of interest. Data are presented as the mean ± SD.
Figure 4
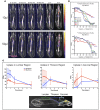
Figure 4. Effect of bolus volume on rostral drug distribution following intrathecal lumbar administration.
(A) Single-photon emission tomography with X-ray computed tomography images from representative animals demonstrating 123I-labeled human serum albumin (123I-HSA) distribution along the rostrocaudal neuraxis following either a 10-μl or 50-μl bolus injection of roughly equivalent amounts of tracer. Note that, due to radioactive decay of 123I over time, images are all scaled differently in order to allow for easier visual interpretation. (B) A graphical depiction of the distribution of 123I-HSA, within a region of interest (ROI) representative of the intrathecal space, spread along the rostrocaudal neuraxis over time. The graphs represent average values from multiple animals (n = 4 for 10 μl infusion, n = 5 for 50 μl infusion). (C) Time-activity curves demonstrating 123I-HSA uptake in the cervical, thoracic, and lumbar regions of the spinal column over time and a depiction of ROIs used for these analyses. Data points represent the mean ± SD. *P < 0.05, **P < 0.01, unpaired 2-tailed Student’s t test. 2-way repeated-measures ANOVA analyses revealed significant differences in overall uptake of 123I-HSA into the cervical (P < 0.001), thoracic (P < 0.01), and lumbar (P < 0.0001) regions of interest (ROIs) over the time course of the experiment attributable to the difference in the volume of bolus administered between the two groups. Mean AUC values: (lumbar: 10 μl = 273, 50 μl = 168), (thoracic: 10 μl = 48.1, 50 μl = 56.3), (cervical: 10 μl = 11.5, 50 μl = 19.3).
Figure 5
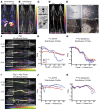
Figure 5. Effect of tissue affinity of a drug on rostral drug distribution following intrathecal lumbar administration.
(A) Static single-photon emission tomography with X-ray computed tomography (SPECT-CT) images of 99mTc-sestamibi 2 hours and 6 hours after intravenous infusion of the tracer into a rat (n = 1 experiment conducted). (B) Static SPECT-CT images of 99mTc-sestamibi 2 hours and 6 hours after 10-μl lumbar intrathecal bolus injection (representative image from cohort of n = 2). (C) Autoradiogram of a whole-body transverse slice through the lumbar region of the spinal column (black arrow) 2 hours after intrathecal injection of 99mTc-sestamibi (n = 1 experiment conducted). Original magnification, ×1. (D) Static SPECT-CT images of 186Re-sestamibi 2 hours and 6 hours after intrathecal bolus infusion of 40 μl of the tracer into an intrathecally catheterized rat (representative image from cohort of n = 2). (E) Microautoradiograms of transverse spinal cord sections from a separate animal that was similarly dosed intrathecally with 186Re-sestamibi via a 40-μl plus 30-μl saline flush bolus (representative image from cohort of n = 2). Top: Images of a microautoradiogram from a thoracic spinal cord section. Top left: As visualized by bright-field microscopy. Top right: As visualized by dark-field microscopy. Bottom: A section from the lumbar (left) and cervical (right) region of the spinal cord, as visualized by dark-field microscopy. WM, white matter; GM, gray matter. Scale bars: 100 μm. (F and I) Static SPECT-CT images of 111In-diethylenetriamine-pentacetic acid (111In-DTPA) (green scale) and 99mTc-sestamibi (fire scale) 0–15 minutes, 2 hours, and 6 hours after lumbar injection of a mixture of the two tracers given as either a (F) 20-μl (n = 6) or (I) 30-μl plus 40-μl saline flush bolus (n = 5). Images are from 1 representative animal from each group. Scale bars: 50 mm. Vertical dotted lines represent the rostral and caudal boundaries of the intrathecal space region of interest created for quantitative analysis. (G, H, J, and K) Quantitative distribution profiles of (G and J) 111In-DTPA and (H and K) 99mTc-sestamibi along the neuraxis from the data from the representative animals presented in F and I.
Figure 6
Figure 6. Application of dual single-photon emission tomography with X-ray computed tomography imaging to monitor differential cerebrospinal fluid–interstitial fluid exchange of drug surrogate molecules.
(A) Static single-photon emission tomography with X-ray computed tomography (SPECT-CT) images of 111In-diethylenetriamine-pentacetic acid (111In-DTPA) (green scale) and 99mTc-sestamibi (fire scale) 0–15 minutes, 2 hours, and 6 hours after intracisternal injection of a 10-μl mixture of the two tracers. Images are from a representative animal from a cohort of n = 4. (B and C) Graphical representations of the rostrocaudal distribution of (B) 111In-DTPA and (C) 99mTc-sestamibi from data from the representative animal presented in A. Scale bars: 50 mm. Vertical dotted lines represent the rostral and caudal boundaries of the intrathecal space region of interest created for quantitative analysis. (D) Close-up cranial images of data presented in A in order to highlight the penetration from the cerebrospinal fluid (CSF) into the interstitial fluid of the brain parenchyma. 111In-DTPA was observed penetrating into the interstitial fluid of the brain parenchyma over the time course of the experiment. In contrast, 99mTc-sestamibi displayed minimal movement from the CSF to the brain parenchyma over a 6-hour time period. Original magnification, ×0.75.

References

    1. Chen Y, Liu L. Modern methods for delivery of drugs across the blood-brain barrier. Adv Drug Deliv Rev. 2012;64(7):640–665. doi: 10.1016/j.addr.2011.11.010. - DOI - PubMed
    1. Zhang ET, Inman CB, Weller RO. Interrelationships of the pia mater and the perivascular (Virchow-Robin) spaces in the human cerebrum. J Anat. 1990;170:111–123. - PMC - PubMed
    1. Iliff JJ, et al. A paravascular pathway facilitates CSF flow through the brain parenchyma and the clearance of interstitial solutes, including amyloid beta. Sci Transl Med. 2012;4(147):e85311. - PMC - PubMed
    1. Krahn V. The pia mater at the site of the entry of blood vessels into the central nervous system. Anat Embryol (Berl) 1982;164(2):257–263. doi: 10.1007/BF00318509. - DOI - PubMed
    1. Sallerin-Caute B, Lazorthes Y, Monsarrat B, Cros J, Bastide R. CSF baclofen levels after intrathecal administration in severe spasticity. Eur J Clin Pharmacol. 1991;40(4):363–365. doi: 10.1007/BF00265844. - DOI - PubMed