. 2016 Apr 21;1(5):e85061.
doi: 10.1172/jci.insight.85061.

Histone deacetylase inhibitor panobinostat induces calcineurin degradation in multiple myeloma

Affiliations

Histone deacetylase inhibitor panobinostat induces calcineurin degradation in multiple myeloma

Yoichi Imai et al. JCI Insight. .

Abstract

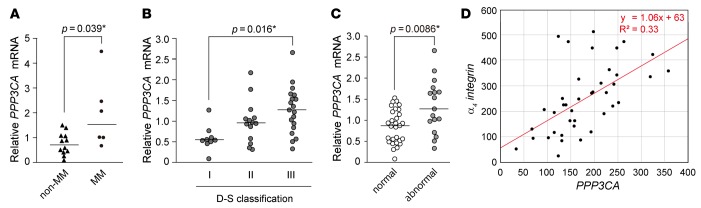
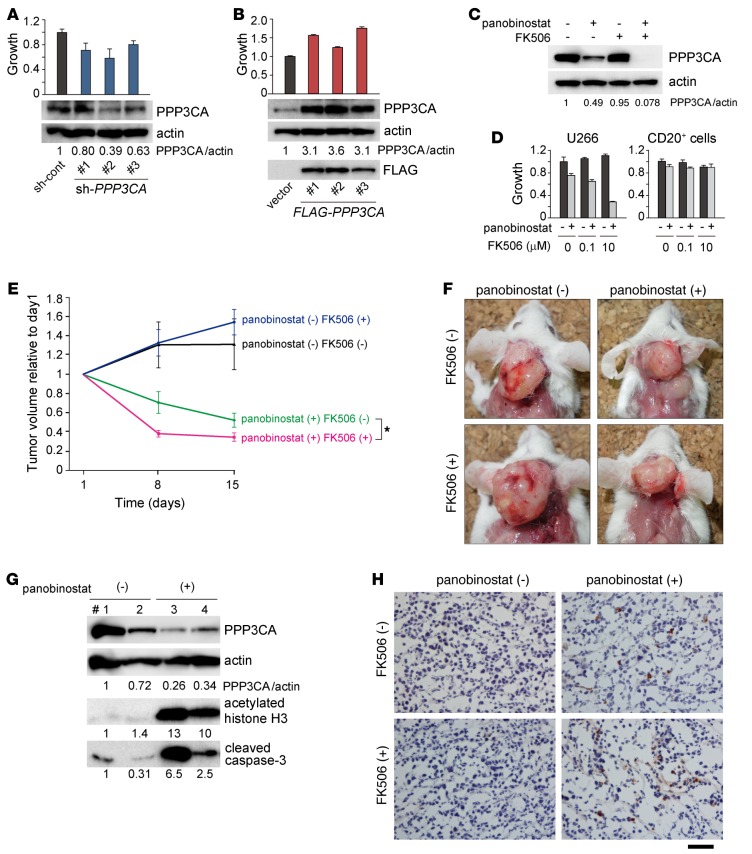
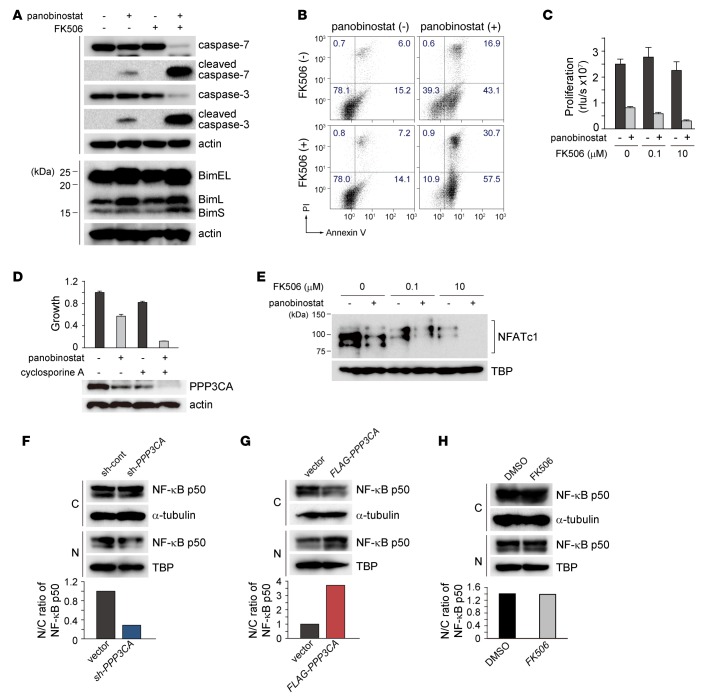
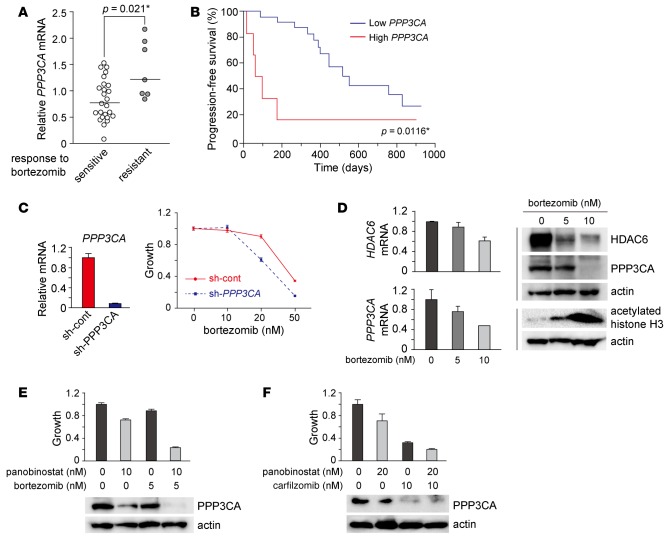
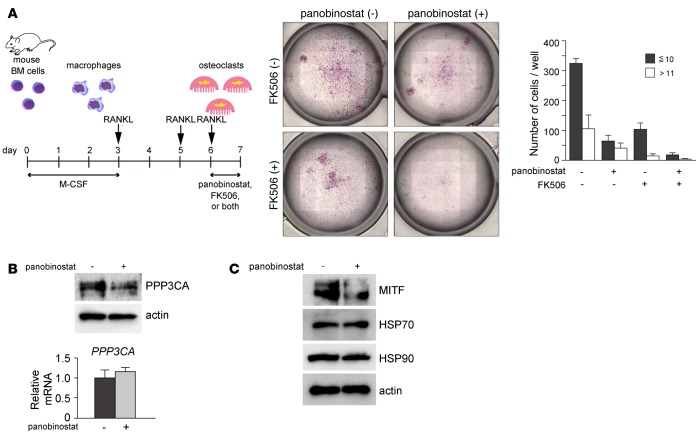
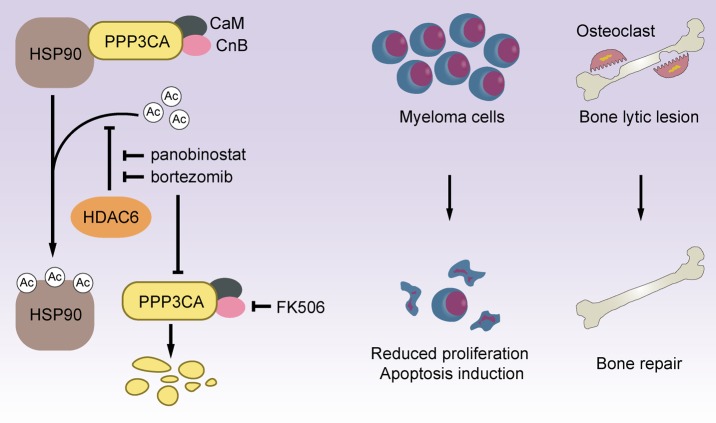
Multiple myeloma (MM) is a relapsed and refractory disease, one that highlights the need for developing new molecular therapies for overcoming of drug resistance. Addition of panobinostat, a histone deacetylase (HDAC) inhibitor, to bortezomib and dexamethasone improved progression-free survival (PFS) in relapsed and refractory MM patients. Here, we demonstrate how calcineurin, when inhibited by immunosuppressive drugs like FK506, is involved in myeloma cell growth and targeted by panobinostat. mRNA expression of PPP3CA, a catalytic subunit of calcineurin, was high in advanced patients. Panobinostat degraded PPP3CA, a degradation that should have been induced by inhibition of the chaperone function of heat shock protein 90 (HSP90). Cotreatment with HDAC inhibitors and FK506 led to an enhanced antimyeloma effect with a greater PPP3CA reduction compared with HDAC inhibitors alone both in vitro and in vivo. In addition, this combination treatment efficiently blocked osteoclast formation, which results in osteolytic lesions. The poor response and short PFS duration observed in the bortezomib-containing therapies of patients with high PPP3CA suggested its relevance to bortezomib resistance. Moreover, bortezomib and HDAC inhibitors synergistically suppressed MM cell viability through PPP3CA inhibition. Our findings underscore the usefulness of calcineurin-targeted therapy in MM patients, including patients who are resistant to bortezomib.


Figures

Figure 1
Figure 1. High expression of PPP3CA (protein phosphatase 3, catalytic subunit, an isozyme) mRNA in advanced MM (multiple myeloma) mRNA in advanced MM patients.
(A) PPP3CA mRNA expression in non-MM (n = 12) and MM cell lines (n = 6) is displayed. Non-MM cell lines are as follows. Acute myeloid leukemia–derived: HEL, HL60, KG-1, THP-1, and U937; B cell acute lymphoblastic leukemia: BALL-1 and NALM6; T cell acute lymphoblastic leukemia (T-ALL): Jurkat and Molt-4; chronic myelogenous leukemia: K562; and B cell lymphoma: Daudi and Raji. MM cell lines are as follows: U266, KMS-11, KMS-12PE, KMS-18, KMS-26, and RPMI8226. Horizontal line, median. Difference between 2 groups was analyzed using 1-tailed t test. *, significant. Two biologically independent experiments were performed. (B) PPP3CA mRNA expression in MM patients with stage I (n = 9), II (n = 14), or III (n = 19) is displayed. D-S, Duri-Salmon classification. Horizontal line, median. The differences between 3 groups of samples was analyzed by ANOVA by the 1-way layout. When the statistic model proved significant, the differences between combinations of the 2 groups were analyzed using a Tukey-Kramer test for multiple comparisons.*, significant. (C) PPP3CA mRNA expression in MM patients with normal (n = 29) or abnormal (n = 17) serum LDH is displayed. Horizontal line, median. Difference between 2 groups was analyzed using 1-tailed t test. *, significant. (D) mRNA expression of PPP3CA and α4 integrins in samples from MM patients reported in the study of Agnelli (20). Correlation coefficient between PPP3CA and α4 integrins expression is displayed.
Figure 2
Figure 2. PPP3CA protein is degraded by HDAC (histone deacetylase) inhibitors in MM cells.
The degree of protein expression change estimated by quantitative analyses of bands is displayed as indicated. (A) U266 and KMS-11 were treated with 20 nM panobinostat for 48 h followed by Western blot analysis. Actin served as a loading control. Nine (U266) and 3 (KMS-11) biologically independent experiments were performed. To determine the expression of PPP3CA mRNA in treated cells for 24 h, we performed relative quantification real-time PCR (n = 6). Four (U266) and 2 (KMS-11) biologically independent experiments were performed. (B) PPP3CA expression in U266 treated with DMSO (vehicle control) or 600 nM 17-AAG for 24 h. Three biologically independent experiments were performed. (C) IP assays using IgG2b or anti-PPP3CA antibody in U266. TCL, total cell lysate. Five biologically independent experiments were performed. (D) Protein expression in U266 treated with 20 nM panobinostat, 5 nM lactacystin, or both panobinostat and lactacystin for 48 h. Two biologically independent experiments were performed. (E) Protein expression in U266 treated with 20 nM panobinostat, 2 nM romidepsin, or 2 µM ACY-1215 for 48 h. Two biologically independent experiments were performed. (F) IP assays using anti-PPP3CA antibody in U266 treated with 2 µM ACY-1215 for 16 h. Two biologically independent experiments were performed. (G) Protein expression in U266 treated with 2 µM ACY-1215, 5 nM lactacystin, or both ACY-1215 and lactacystin for 48 h. Two biologically independent experiments were performed. (H) HSP70 protein expression in U266 treated with 600 nM 17-AAG for 24 hours. Two technically independent experiments were performed. (I) HSP70 expression in U266 treated with 20 nM panobinostat, 10 µM FK506, or both panobinostat and FK506 as indicated for 36 h. Cotreatment with 0.75 µM ACY-1215 and 10 µM FK506 for 48 h was also performed. Two biologically independent experiments were performed.
Figure 3
Figure 3. Calcineurin is indispensable for the maintenance of MM cell growth.
The degree of protein expression change estimated by quantitative analyses of bands is displayed as indicated. (A) U266 was lentivirally transduced with control vector (sh-cont) or 3 different shRNAs against PPP3CA (KD #1, #2, and #3). Cell growth was determined by MTT assays (n = 5), and PPP3CA expression levels are displayed. Two biologically independent experiments were performed. (B) KMS-11 was lentivirally transduced with control vector or FLAG-PPP3CA (clone #1, #2, and #3). Cell growth (n = 5), and PPP3CA expression are displayed. Four (cell growth) and 2 (PPP3CA expression) biologically independent experiments were performed. (C) U266 was treated with 20 nM panobinostat, 10 µM FK506, or both panobinostat and FK506 as indicated for 36 h. Five biologically independent experiments were performed. (D) MTT assays in U266 and CD20-positive cells treated with 15 nM panobinostat, FK506, or both panobinostat and FK506 as indicated for 36 h (n = 5). Three biologically independent experiments were performed. (E) NOD/SCID (NOD/ShiJic-scid Jcl) mice bearing U266 cells were treated with vehicle (n = 6), panobinostat (n = 9), FK506 (n = 6), or both panobinostat and FK506 (n = 11). Treatment was continued for 15 days. Average of the ratio of the tumor volume on days 8 and 15 to that on day 1 is displayed for each condition. Error bars represent the standard errors. Difference between panobinostat (+)/FK506 (–) and panobinostat (+)/FK506 (+) on day 15 was analyzed using Scheffe test. *, significant. (F) The representative images of tumors of each group. (G) Protein expression in tumors of xenograft of mouse model. #1 and #2: vehicle treated. #3 and #4: panobinostat treated. Two biologically independent experiments were performed. (H) The representative immunohistochemical stainings by anti–cleaved caspase-3 are displayed (×40). The brown cells are positive for staining. Scale bar: 50 microns. Six biologically independent experiments were performed.
Figure 4
Figure 4. Calcineurin inhibition enhances apoptosis and blocks proliferation, and PPP3CA regulates NF-κB signaling in MM cells.
(A) Apoptotic protein expression of KMS-11 treated with 20 nM panobinostat, 10 µM FK506, or both panobinostat and FK506 for 36 h is displayed. Two biologically independent experiments were performed. (B) KMS-11 was treated with 20 nM panobinostat, 10 µM FK506, or both panobinostat and FK506 for 36 h. Induced apoptosis was evaluated by flow cytometry. Annexin V (+) and propidium iodide (PI) (–): early apoptotic cells. Annexin V (+) PI (+): late apoptotic cells. Two biologically independent experiments were performed. (C) BrdU assays in KMS-11 treated with 15 nM panobinostat, FK506, or both panobinostat and FK506 as indicated for 48 h (n = 6). Two biologically independent experiments were performed. (D) Cell growth and PPP3CA expression in U266 treated with 20 nM panobinostat, 10 µM cyclosporine A, or both panobinostat and cyclosporine A as indicated for 48 h (n = 5). Two biologically independent experiments were performed. (E) NFATc1 (nuclear factor of activated T cells, cytoplasmic, calcineurin-dependent 1) protein in U266 treated with 20 nM panobinostat, FK506, or both panobinostat and FK506 as indicated for 72 h. TATA-binding protein (TBP) served as a loading control. Four biologically independent experiments were performed. (F and G) Cytoplasmic (C) and nuclear (N) NF-κB p50 in U266 lentivirally transduced with control vector (sh-cont) or shRNA against PPP3CA (sh-PPP3CA) (F) and control vector (vector) or PPP3CA (FLAG-PPP3CA) (G). α-tubulin and TBP served as a loading control. N/C ratios of NF-κB p50 are also displayed. Two biologically independent experiments were performed. (H) C and N NF-κB p50 in U266 treated with DMSO or 10 µM FK506 for 48 h followed by Western blot analysis. Two technically independent experiments were performed.
Figure 5
Figure 5. PPP3CA is a common target of panobinostat and bortezomib.
(A) PPP3CA mRNA expression in MM patients treated with VMP (bortezomib, melphalan, and prednisone) or BD (bortezomib, dexamethasone). Sensitive: patients with partial response or better (n = 25). Resistant: patients with stable disease or death during therapy (n = 7). Horizontal lines, median. Difference between 2 groups of samples were analyzed using 1-tailed t test. *, significant. (B) Kaplan-Meier curve of progression-free survival (PFS) of MM patients treated with VMP or BD. Low PPP3CA (n = 26): relative PPP3CA mRNA is less than 1.5. High PPP3CA (n = 6): relative PPP3CA mRNA is 1.5 or more. The difference in PFS between the 2 groups was analyzed using a Log-rank test. *, significant. (C) U266 transduced with a control vector (sh-cont) or shRNA against PPP3CA (KD #2) was treated with bortezomib as indicated for 48 h. PPP3CA mRNA expression was estimated by analyses of 6 samples for each clone. The ratio of MTT values at each bortezomib concentration to that at 0 nM is displayed (n = 5). Similar results were obtained for KD #1 and #3 (data not shown). Two biologically independent experiments were performed. (D) HDAC6 and PPP3CA expression in U266 treated with bortezomib as indicated for 12 h (mRNA analysis) or 72 h (protein analysis). Three (mRNA analysis: n = 2) and 2 (protein analysis) biologically independent experiments were performed. (E) Cell growth (n = 5) and PPP3CA expression levels in U266 treated with panobinostat, bortezomib, or both panobinostat and bortezomib for 72 h. Three (cell growth) and 2 (PPP3CA expression) biologically independent experiments were performed. (F) Cell growth (n = 5) and PPP3CA expression in KMS-11 treated with 20 nM panobinostat and 10 nM carfilzomib for 24 h. Two biologically independent experiments were performed.
Figure 6
Figure 6. Panobinostat blocks osteoclast formation.
(A) Panobinostat (5 nM), FK506 (100 nM), or both panobinostat and FK506 were added to the medium after the third stimulation of macrophages differentiated from mouse BM mononuclear cells by RANKL (receptor activator nuclear factor-κ-B ligand). The cells were cultured for 24 h as illustrated. M-CSF, macrophage colony-stimulating factor. Images and colony counts of the differentiated osteoclasts in each condition are displayed (n = 4). Black, colonies with 10 or fewer nuclei. White, colonies with 11 or more nuclei. Three biologically independent experiments were performed. (B) PPP3CA protein and PPP3CA mRNA expression (n = 3) in osteoclasts treated with 1 nM panobinostat for 24 h after stimulation by RANKL. Two biologically independent experiments were performed. (C) Protein expression in osteoclasts treated with 1 nM panobinostat for 24 h after stimulation by RANKL. Two biologically independent experiments were performed.
Figure 7
Figure 7. Proposed molecular mechanism of the clinical effects of calcineurin-targeting therapy in MM patients.
Schematic representation of the reduction in PPP3CA induced by panobinostat and bortezomib and the expected clinical effects of PPP3CA reduction in MM patients are displayed. CaM, calmodulin; CnB, calcineurin B; Ac, acetylation.

References

    1. Richardson PG, et al. PANORAMA 2: panobinostat in combination with bortezomib and dexamethasone in patients with relapsed and bortezomib-refractory myeloma. Blood. 2013;122(14):2331–2337. doi: 10.1182/blood-2013-01-481325. - DOI - PubMed
    1. San-Miguel JF, et al. Panobinostat plus bortezomib and dexamethasone versus placebo plus bortezomib and dexamethasone in patients with relapsed or relapsed and refractory multiple myeloma: a multicenter, randomised, double-blind phase 3 trial. Lancet Oncol. 2014;15(11):1195–1206. doi: 10.1016/S1470-2045(14)70440-1. - DOI - PubMed
    1. Hideshima T, et al. Small-molecule inhibition of proteasome and aggresome function induces synergistic antitumor activity in multiple myeloma. Proc Natl Acad Sci U S A. 2005;102(24):8567–8572. doi: 10.1073/pnas.0503221102. - DOI - PMC - PubMed
    1. Hideshima T, Richardson PG, Anderson KC. Mechanism of action of proteasome inhibitors and deacetylase inhibitors and the biological basis of synergy in multiple myeloma. Mol Cancer Ther. 2011;10(11):2034–2042. doi: 10.1158/1535-7163.MCT-11-0433. - DOI - PMC - PubMed
    1. Catley L, et al. Aggresome induction by proteasome inhibitor bortezomib and alpha-tubulin hyperacetylation by tubulin deacetylase (TDAC) inhibitor LBH589 are synergistic in myeloma cells. Blood. 2006;108(10):3441–3449. doi: 10.1182/blood-2006-04-016055. - DOI - PMC - PubMed

Publication types