

Automated Quantification of Nonperfusion in Three Retinal Plexuses Using Projection-Resolved Optical Coherence Tomography Angiography in Diabetic Retinopathy
- PMID: 27699408
- PMCID: PMC5054727
- DOI: 10.1167/iovs.16-19776
Automated Quantification of Nonperfusion in Three Retinal Plexuses Using Projection-Resolved Optical Coherence Tomography Angiography in Diabetic Retinopathy
Abstract
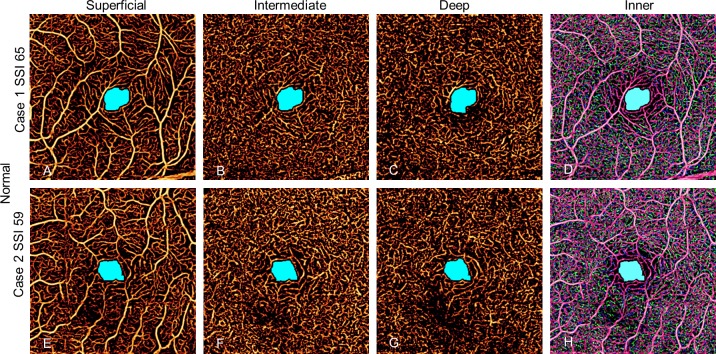
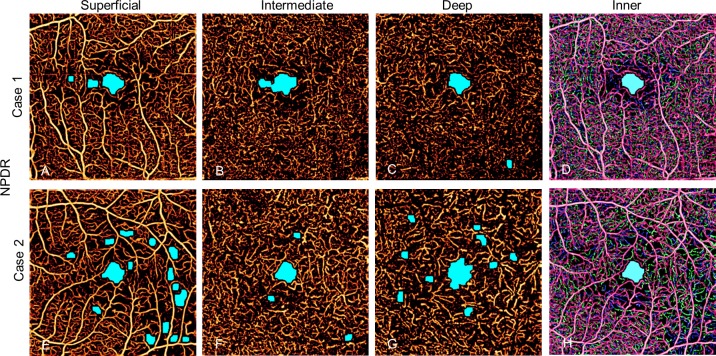
Purpose: The purpose of this study was to evaluate an automated algorithm for detecting avascular area (AA) in optical coherence tomography angiograms (OCTAs) separated into three individual plexuses using a projection-resolved technique.
Methods: A 3 × 3 mm macular OCTA was obtained in 13 healthy and 13 mild nonproliferative diabetic retinopathy (NPDR) participants. A projection-resolved algorithm segmented OCTA into three vascular plexuses: superficial, intermediate, and deep. An automated algorithm detected AA in each of the three plexuses that were segmented and in the combined inner-retinal angiograms. We assessed the diagnostic accuracy of extrafoveal and total AA using segmented and combined angiograms, the agreement between automated and manual detection of AA, and the within-visit repeatability.
Results: The sum of extrafoveal AA from the segmented angiograms was larger in the NPDR group by 0.17 mm2 (P < 0.001) and detected NPDR with 94.6% sensitivity (area under the receiver operating characteristic curve [AROC] = 0.99). In the combined inner-retinal angiograms, the extrafoveal AA was larger in the NPDR group by 0.01 mm2 (P = 0.168) and detected NPDR with 26.9% sensitivity (AROC = 0.62). The total AA, inclusive of the foveal avascular zone, in the segmented and combined angiograms, detected NPDR with 23.1% and 7.7% sensitivity, respectively. The agreement between the manual and automated detection of AA had a Jaccard index of >0.8. The pooled SDs of AA were small compared with the difference in mean for control and NPDR groups.
Conclusions: An algorithm to detect AA in OCTA separated into three individual plexuses using a projection-resolved algorithm accurately distinguishes mild NPDR from control eyes. Automatically detected AA agrees with manual delineation and is highly repeatable.
Figures
References
-
- Congdon N, O'Colmain B, Klaver CC, et al. ; . for the Eye Diseases Prevalence Research Group. Causes and prevalence of visual impairment among adults in the United States. Arch Ophthalmol. 2004; 122: 477–485. - PubMed
-
- Panel AR. Preferred Practice Pattern, Diabetic Retinopathy. San Francisco CA: American Academy of Ophthalmology; 2014: 1–65.
-
- Antonetti DA,, Klein R,, Gardner TW. Diabetic retinopathy. N Engl J Med. 2012; 366: 1227–1239. - PubMed
-
- Early Treatment Diabetic Retinopathy Study Research Group. Fluorescein angiographic risk factors for progression of diabetic retinopathy: ETDRS report number 13. Ophthalmology. 1991; 98: 834–840. - PubMed
-
- Early Treatment Diabetic Retinopathy Study Research Group. Classification of diabetic retinopathy from fluorescein angiograms: ETDRS report number 11. Ophthalmology. 1991; 98: 807–822. - PubMed
MeSH terms
Grants and funding
LinkOut - more resources
Full Text Sources
Other Literature Sources
Medical
