

Three pairs of weak interactions precisely regulate the G-loop gate of Kir2.1 channel
- PMID: 27699887
- PMCID: PMC5317092
- DOI: 10.1002/prot.25176
Three pairs of weak interactions precisely regulate the G-loop gate of Kir2.1 channel
Abstract
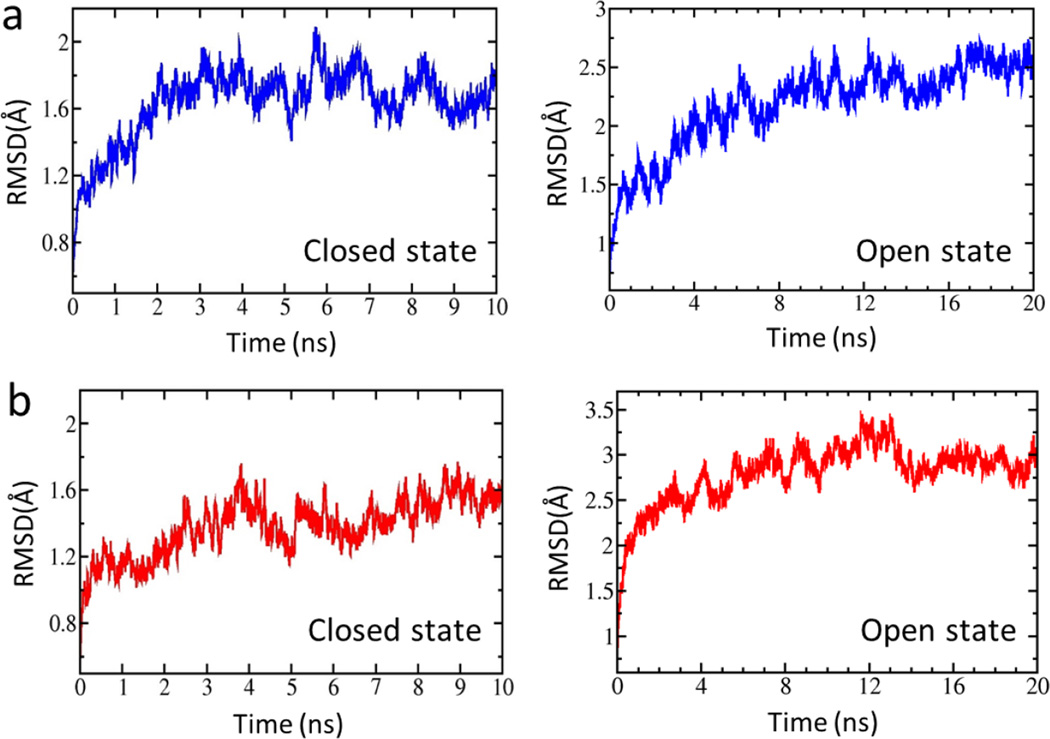
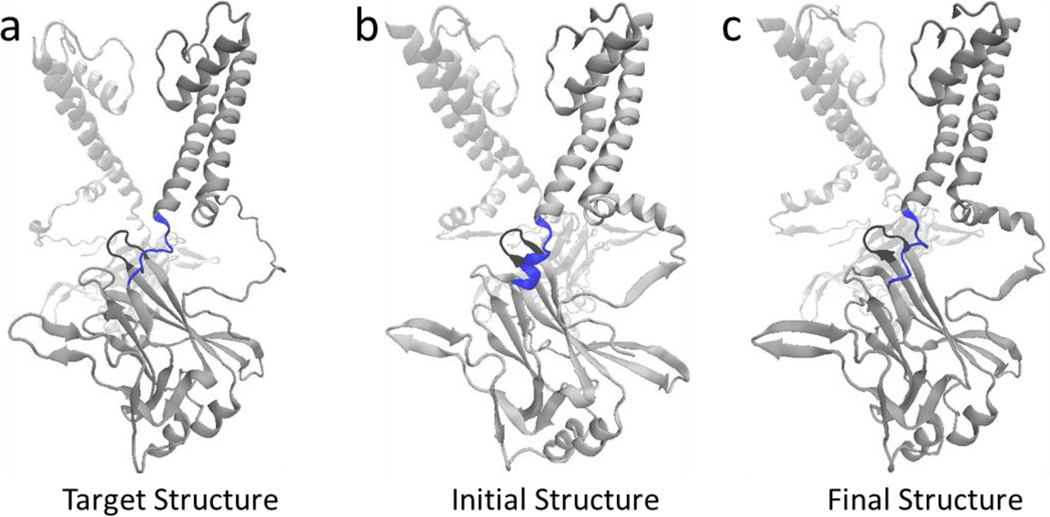
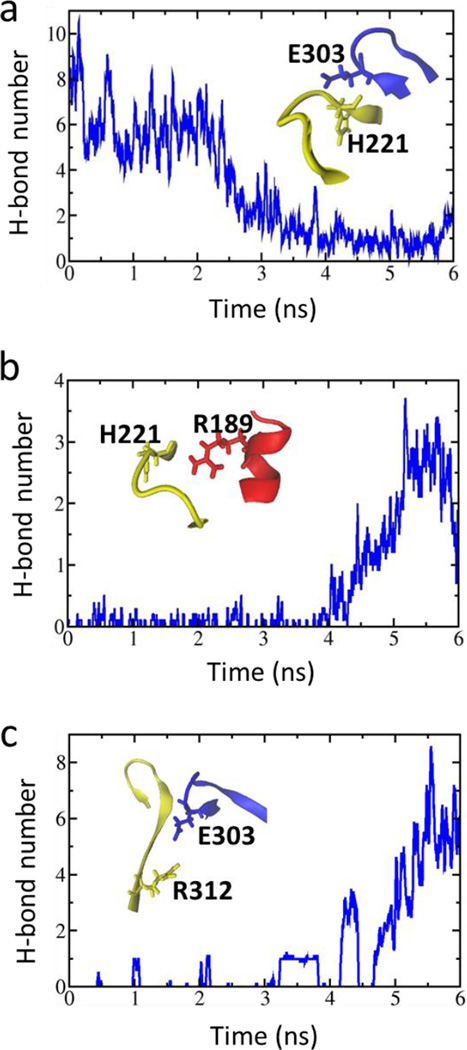
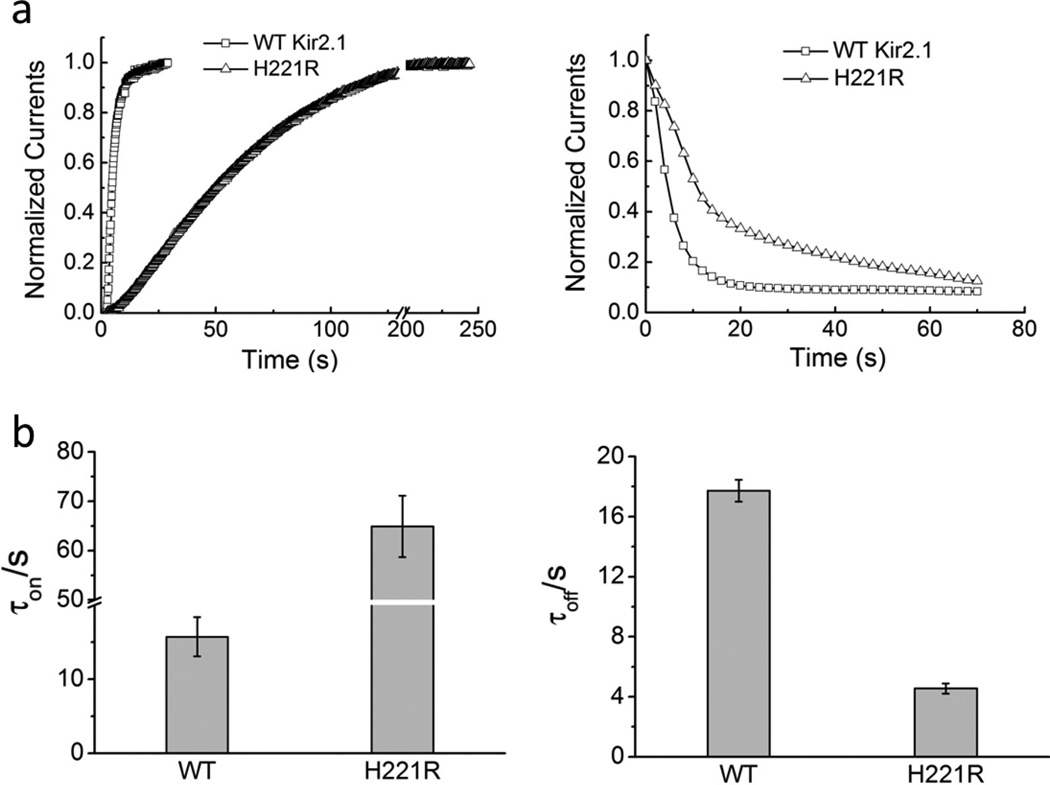
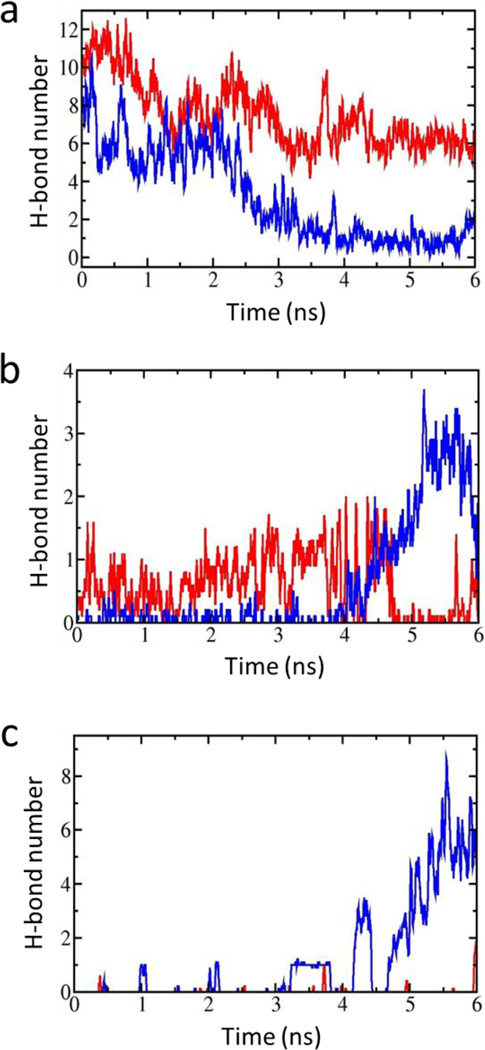
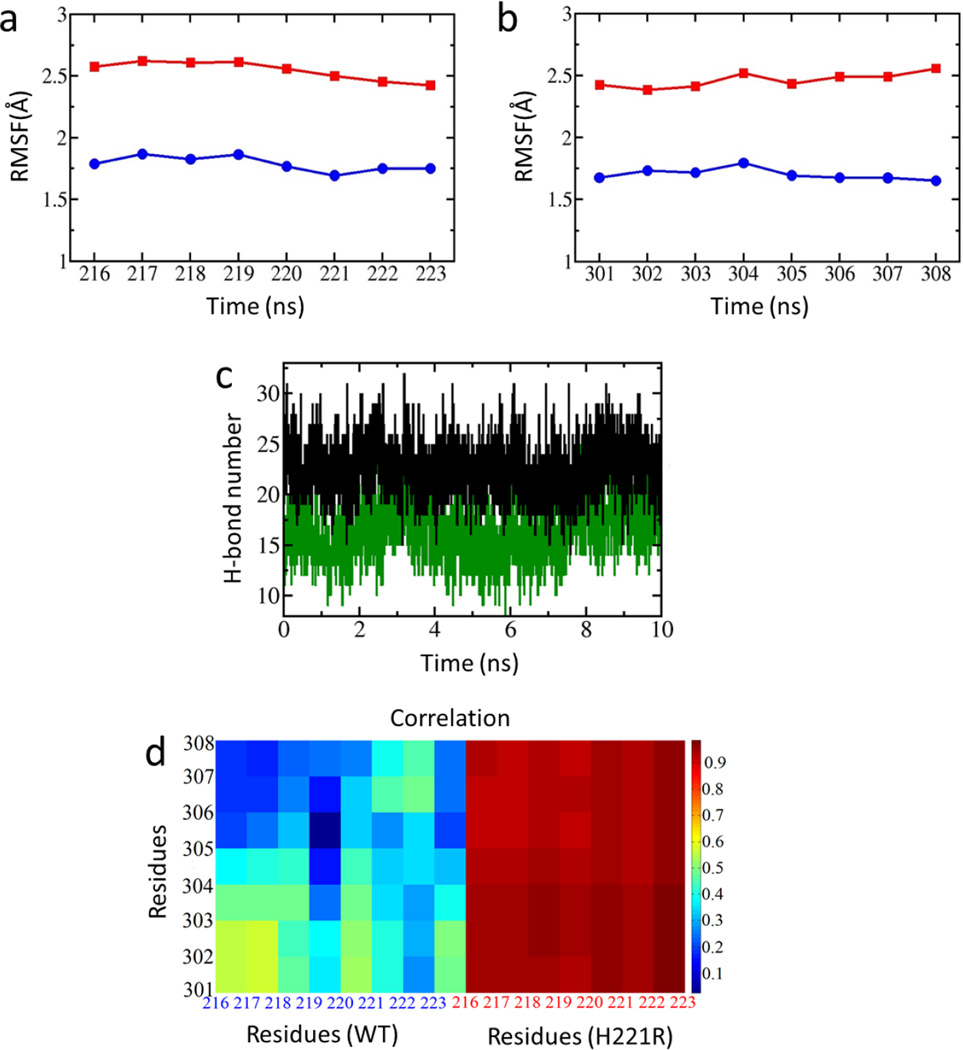
Kir2.1 (also known as IRK1) plays key roles in regulation of resting membrane potential and cell excitability. To achieve its physiological roles, Kir2.1 performs a series of conformational transition, named as gating. However, the structural basis of gating is still obscure. Here, we combined site-directed mutation, two-electrode voltage clamp with molecular dynamics simulations and determined that H221 regulates the gating process of Kir2.1 by involving a weak interaction network. Our data show that the H221R mutant accelerates the rundown kinetics and decelerates the reactivation kinetics of Kir2.1. Compared with the WT channel, the H221R mutation strengthens the interaction between the CD- and G-loops (E303-R221) which stabilizes the close state of the G-loop gate and weakens the interactions between C-linker and CD-loop (R221-R189) and the adjacent G-loops (E303-R312) which destabilizes the open state of G-loop gate. Our data indicate that the three pairs of interactions (E303-H221, H221-R189 and E303-R312) precisely regulate the G-loop gate by controlling the conformation of G-loop. Proteins 2016; 84:1929-1937. © 2016 Wiley Periodicals, Inc.
Keywords: Kir channel; gating kinetics; homology model; molecular dynamics; targeted molecular dynamics; weak interaction.
© 2016 The Authors Proteins: Structure, Function, and Bioinformatics Published by Wiley Periodicals, Inc.
Figures
References
-
- Hibino H, Inanobe A, Furutani K, Murakami S, Findlay I, Kurachi Y. Inwardly rectifying potassium channels: their structure, function, and physiological roles. Physiol Rev. 2010;90:291–366. - PubMed
-
- Pruss H, Derst C, Lommel R, Veh RW. Differential distribution of individual subunits of strongly inwardly rectifying potassium channels (Kir2 family) in rat brain. Brain Res Mol Brain Res. 2005;139:63–79. - PubMed
-
- Miyashita T, Kubo Y. Localization and developmental changes of the expression of two inward rectifying K(+)-channel proteins in the rat brain. Brain Res. 1997;750:251–263. - PubMed
-
- Kubo Y, Baldwin TJ, Jan YN, Jan LY. Primary structure and functional expression of a mouse inward rectifier potassium channel. Nature. 1993;362:127–133. - PubMed
-
- Doupnik CA, Davidson N, Lester HA. The inward rectifier potassium channel family. Curr Opin Neurobiol. 1995;5:268–277. - PubMed
Publication types
MeSH terms
Substances
Grants and funding
LinkOut - more resources
Full Text Sources
Other Literature Sources
