

Instantaneous ion configurations in the K+ ion channel selectivity filter revealed by 2D IR spectroscopy
- PMID: 27701114
- PMCID: PMC5544905
- DOI: 10.1126/science.aag1447
Instantaneous ion configurations in the K+ ion channel selectivity filter revealed by 2D IR spectroscopy
Abstract
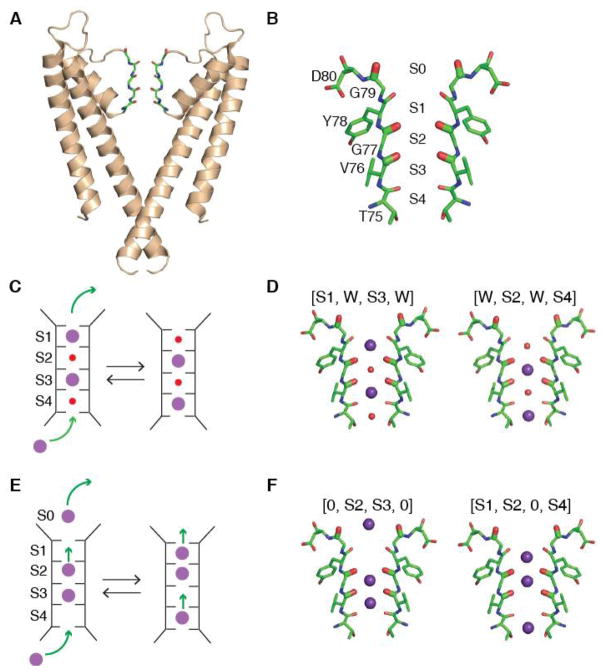
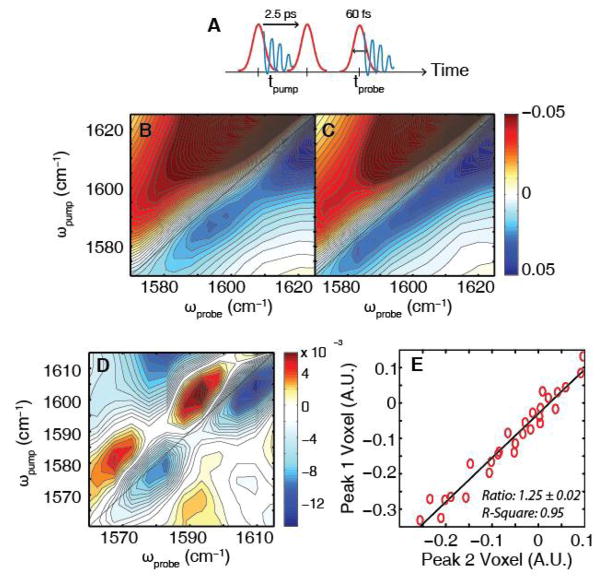
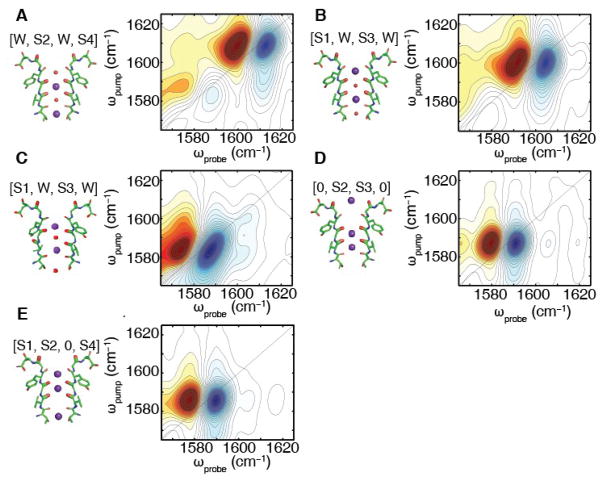
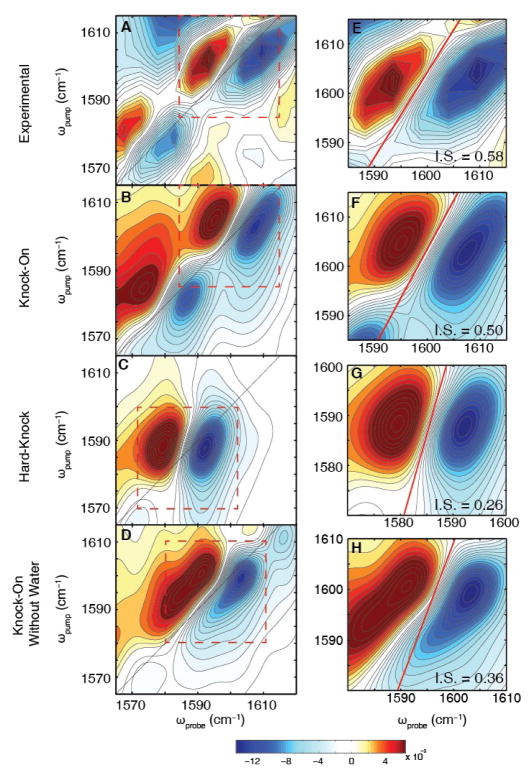
Potassium channels are responsible for the selective permeation of K+ ions across cell membranes. K+ ions permeate in single file through the selectivity filter, a narrow pore lined by backbone carbonyls that compose four K+ binding sites. Here, we report on the two-dimensional infrared (2D IR) spectra of a semisynthetic KcsA channel with site-specific heavy (13C18O) isotope labels in the selectivity filter. The ultrafast time resolution of 2D IR spectroscopy provides an instantaneous snapshot of the multi-ion configurations and structural distributions that occur spontaneously in the filter. Two elongated features are resolved, revealing the statistical weighting of two structural conformations. The spectra are reproduced by molecular dynamics simulations of structures with water separating two K+ ions in the binding sites, ruling out configurations with ions occupying adjacent sites.
Copyright © 2016, American Association for the Advancement of Science.
Figures
Similar articles
-
Probing Ion Configurations in the KcsA Selectivity Filter with Single-Isotope Labels and 2D IR Spectroscopy.J Am Chem Soc. 2023 Aug 23;145(33):18529-18537. doi: 10.1021/jacs.3c05339. Epub 2023 Aug 14. J Am Chem Soc. 2023. PMID: 37578394 Free PMC article.
-
Potassium channel, ions, and water: simulation studies based on the high resolution X-ray structure of KcsA.Biophys J. 2003 Nov;85(5):2787-800. doi: 10.1016/S0006-3495(03)74702-X. Biophys J. 2003. PMID: 14581184 Free PMC article.
-
Absence of ion-binding affinity in the putatively inactivated low-[K+] structure of the KcsA potassium channel.Structure. 2011 Jan 12;19(1):70-9. doi: 10.1016/j.str.2010.10.008. Structure. 2011. PMID: 21220117
-
Importance of hydration and dynamics on the selectivity of the KcsA and NaK channels.J Gen Physiol. 2007 Feb;129(2):135-43. doi: 10.1085/jgp.200609633. Epub 2007 Jan 16. J Gen Physiol. 2007. PMID: 17227917 Free PMC article. Review.
-
Ion permeation in potassium ion channels.Acta Crystallogr D Struct Biol. 2020 Apr 1;76(Pt 4):326-331. doi: 10.1107/S2059798320003599. Epub 2020 Apr 1. Acta Crystallogr D Struct Biol. 2020. PMID: 32254056 Free PMC article. Review.
Cited by
-
Femtosecond Electron-Transfer Dynamics across the D2O/Cs+/Cu(111) Interface: The Impact of Hydrogen Bonding.J Phys Chem C Nanomater Interfaces. 2023 Nov 17;127(48):23467-23474. doi: 10.1021/acs.jpcc.3c06172. eCollection 2023 Dec 7. J Phys Chem C Nanomater Interfaces. 2023. PMID: 38264237 Free PMC article.
-
Shaker-IR K+ channel gating in heavy water: Role of structural water molecules in inactivation.J Gen Physiol. 2021 Jun 7;153(6):e202012742. doi: 10.1085/jgp.202012742. Epub 2021 May 20. J Gen Physiol. 2021. PMID: 34014250 Free PMC article.
-
Refinement of Peptide Conformational Ensembles by 2D IR Spectroscopy: Application to Ala‒Ala‒Ala.Biophys J. 2018 Jun 19;114(12):2820-2832. doi: 10.1016/j.bpj.2018.05.003. Biophys J. 2018. PMID: 29925019 Free PMC article.
-
Inhibition of vibrational energy flow within an aromatic scaffold via heavy atom effect.J Chem Phys. 2023 Jun 14;158(22):224201. doi: 10.1063/5.0153760. J Chem Phys. 2023. PMID: 37309893 Free PMC article.
-
Structural Dynamics of the Slide Helix of Inactive/Closed Conformation of KirBac1.1 in Micelles and Membranes: A Fluorescence Approach.J Membr Biol. 2025 Feb;258(1):97-112. doi: 10.1007/s00232-024-00335-y. Epub 2025 Jan 9. J Membr Biol. 2025. PMID: 39789244 Free PMC article.
References
-
- Hille B. Ion Channels of Excitable Membranes. Sinauer Associates, Inc; Sunderland, Massachusetts: 2001. p. 814.
-
- Heginbotham L, Abramson T, MacKinnon R. A functional connection between the pores of distantly related ion channels as revealed by mutant K+ channels. Science. 1992;258:1152–1155. - PubMed
-
- Doyle DA, et al. The Structure of the Potassium Channel: Molecular Basis of K+ Conduction and Selectivity. Science. 1998;280:69–77. - PubMed
Publication types
MeSH terms
Substances
Grants and funding
LinkOut - more resources
Full Text Sources
Other Literature Sources
