. 2016 Nov 1;126(11):4140-4156.
doi: 10.1172/JCI87734. Epub 2016 Oct 4.

Cancer-associated fibroblast-derived annexin A6+ extracellular vesicles support pancreatic cancer aggressiveness

Cancer-associated fibroblast-derived annexin A6+ extracellular vesicles support pancreatic cancer aggressiveness

Julie Leca et al. J Clin Invest. .

Abstract

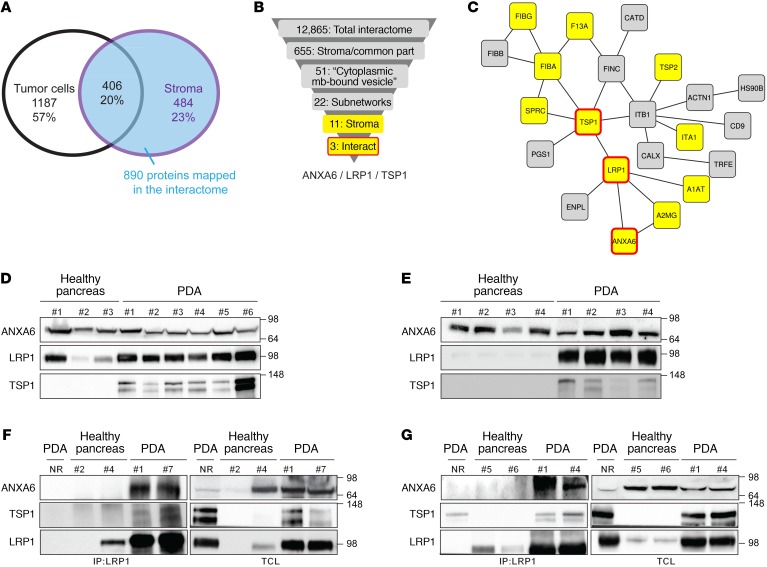
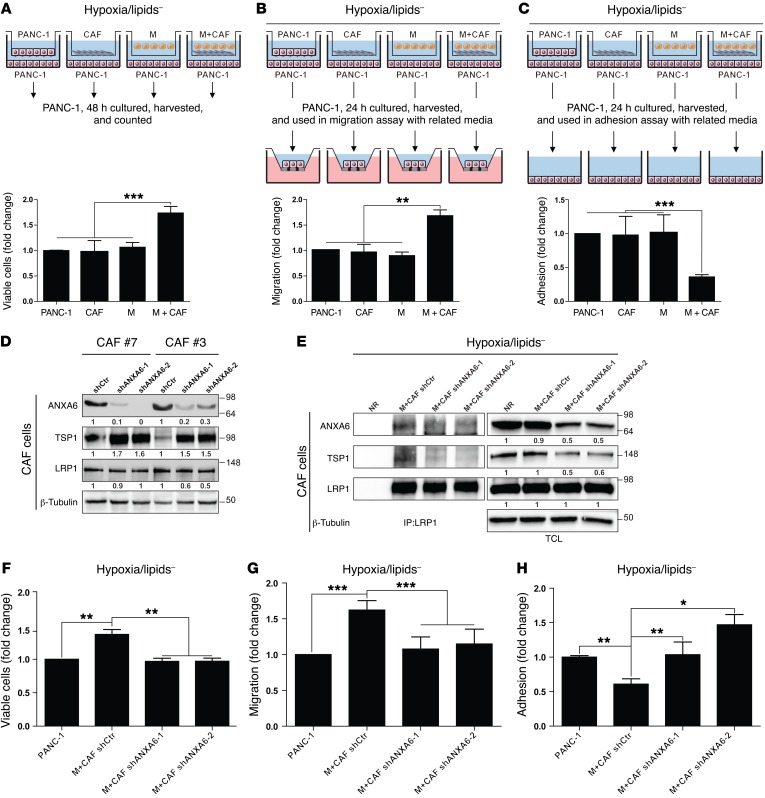
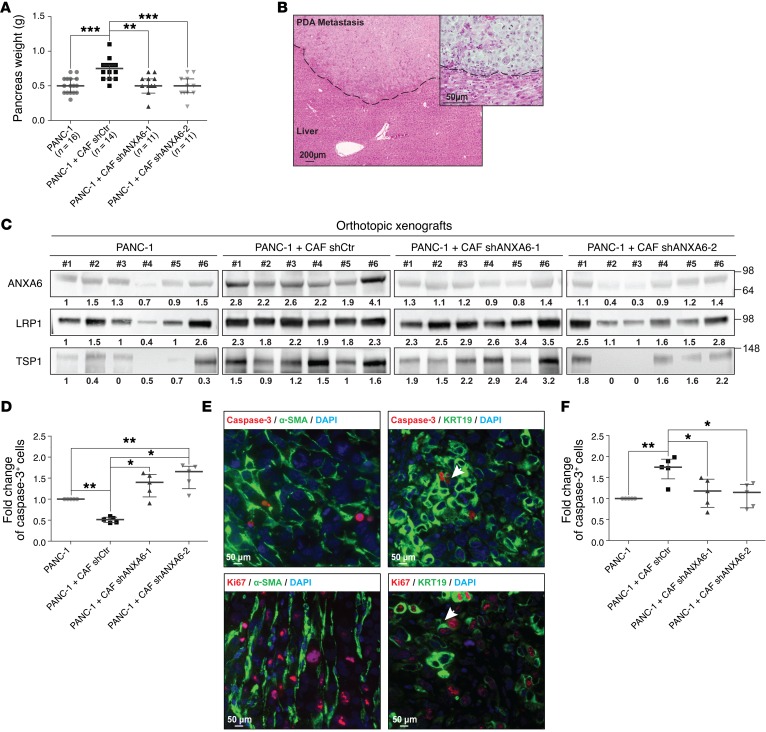
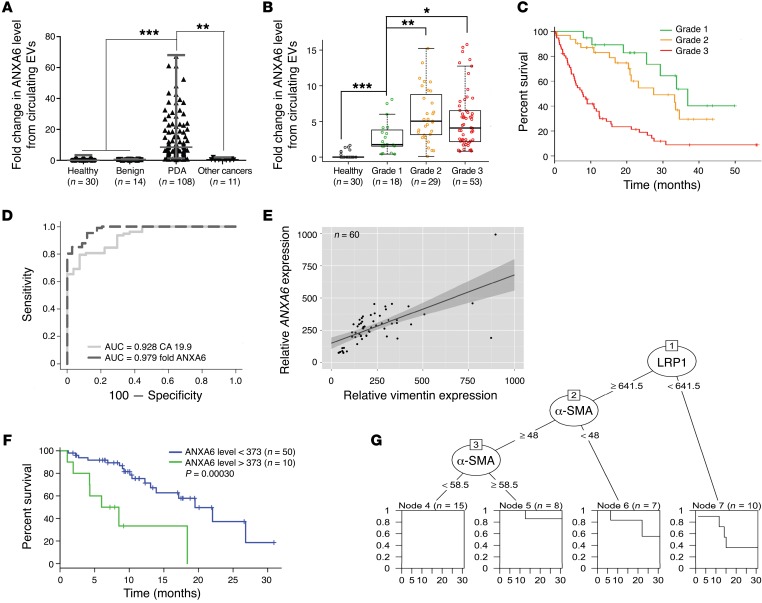
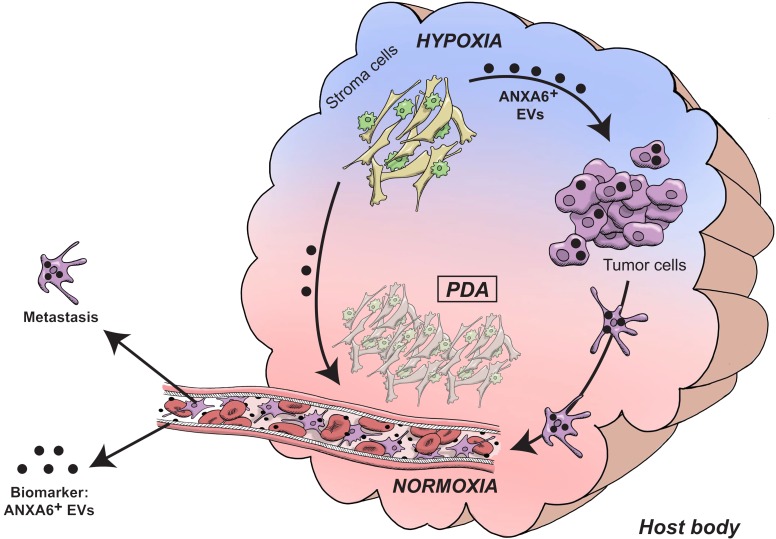
The intratumoral microenvironment, or stroma, is of major importance in the pathobiology of pancreatic ductal adenocarcinoma (PDA), and specific conditions in the stroma may promote increased cancer aggressiveness. We hypothesized that this heterogeneous and evolving compartment drastically influences tumor cell abilities, which in turn influences PDA aggressiveness through crosstalk that is mediated by extracellular vesicles (EVs). Here, we have analyzed the PDA proteomic stromal signature and identified a contribution of the annexin A6/LDL receptor-related protein 1/thrombospondin 1 (ANXA6/LRP1/TSP1) complex in tumor cell crosstalk. Formation of the ANXA6/LRP1/TSP1 complex was restricted to cancer-associated fibroblasts (CAFs) and required physiopathologic culture conditions that improved tumor cell survival and migration. Increased PDA aggressiveness was dependent on tumor cell-mediated uptake of CAF-derived ANXA6+ EVs carrying the ANXA6/LRP1/TSP1 complex. Depletion of ANXA6 in CAFs impaired complex formation and subsequently impaired PDA and metastasis occurrence, while injection of CAF-derived ANXA6+ EVs enhanced tumorigenesis. We found that the presence of ANXA6+ EVs in serum was restricted to PDA patients and represents a potential biomarker for PDA grade. These findings suggest that CAF-tumor cell crosstalk supported by ANXA6+ EVs is predictive of PDA aggressiveness, highlighting a therapeutic target and potential biomarker for PDA.


Figures

Figure 1
Figure 1. Human PDA microdissection followed by mass spectrometry coupled to bioinformatics analyses identifies a new complex in stroma PDA.
(A) Number of proteins (and representative total percentage) obtained after mass spectrometry analysis of stroma and tumor cell areas microdissected from frozen human PDA slides (patients, n = 4; microdissected areas ranged from 30 to 50 mm2). (B) Graphical representation explaining how the complex comprising ANXA6, LRP1, and TSP1 was highlighted. (C) Twenty-two proteins belong to the same network of “cytoplasmic membrane-bound vesicles” obtained in Supplemental Figure 1D. Proteins in yellow boxes are specific to the stromal compartment, and proteins in yellow boxes surrounded by a red line are complex proteins obtained. (D) Western blot analysis of ANXA6, LRP1, and TSP1 in human healthy pancreas (#1–3) and PDA (#1–6). Amido black staining served as loading control. (E) Western blot analysis of ANXA6, LRP1, and TSP1 in murine healthy pancreas (#1–4) and PDA (#1–4). Amido black staining served as loading control. (F and G) Coimmunoprecipitation of LRP1 with ANXA6 and TSP1 in protein extracts from human (F) healthy pancreas (#2, #4) and PDA (#1, #7) and from murine (G) healthy pancreas (#5, #6) and PDA (#1, #4). Total cell lysate and nonrelevant antibody (NR) were used as loading and negative control, respectively. Data are representative of 3 independent experiments. Throughout the article, each “#” represents 1 PDA patient or mouse or 1 healthy donor or mouse.
Figure 2
Figure 2. Microenvironment cells, and mainly CAFs, express ANXA6, LRP1, and TSP1 in PDA.
(A) Representative micrographs and quantification of ANXA6, LRP1, or TSP1 staining in human healthy pancreas or PDA (median value ± interquartile range, n = 3). Asterisks, tumor cells; triangles, stromal compartment. (B) Representative micrographs and quantification of ANXA6, LRP1, or TSP1 staining with KRT19, α-SMA, or CD68 (median value ± interquartile range, n = 3). (C) Relative expression of ANXA6, LRP1, and TSP1 mRNA in established PDA tumor cell lines (n = 3, MIA PaCa-2, PANC-1, and Capan-2), primary PDA tumor cells (n = 4), macrophages (Raw, n = 2), primary PDA CAFs (n = 9), and normal human fibroblasts (NHF, n = 3). Data are expressed as fold increase compared with MIA PaCa-2 (median ± interquartile range). *P < 0.05, **P < 0.01, Mann-Whitney U test. (D) Western blot of the indicated proteins in lysates from PDA tumor cell lines (PANC-1), primary PDA tumor cells (n = 3), macrophages (Raw), primary PDA CAFs (n = 3), and normal human fibroblasts (NHF). Quantifications are expressed as fold increase compared with either PANC-1 or primary PDA tumor cells #1. (E) Linear regression of α-SMA versus ANXA6 expression levels in primary PDA CAFs (n = 15, from different #’s). Dashed lines represent 95% CI. (F) Western blot of the indicated proteins following endogenous coimmunoprecipitation with anti-LRP1 antibody in CAF lysates. TCL, total cell lysates. (G) Graphical representation of the various culture conditions. HYPO, hypoxia (1% O2); NOR, normoxia (20% O2). (H) Western blot of the indicated proteins following endogenous coimmunoprecipitation with nonrelevant antibody (NR) as negative control or anti-LRP1 antibody in lysates from CAFs cultured under various conditions. (C, D, F, H) Data are representative of 3 independent experiments.
Figure 3
Figure 3. CAF-mediated support to cancer cells depends on ANXA6 present within the ternary complex.
(A) Graphical representation of the culture protocol for measuring PANC-1 cell viability (median ± interquartile range, n = 3). ***P < 0.001, Mann-Whitney U test. (B) Graphical representation of the culture protocol for measuring PANC-1 migration ability (median ± interquartile range, n = 3). **P < 0.05, Mann-Whitney U test. (C) Graphical representation of the culture protocol for measuring PANC-1 adhesion ability (median ± interquartile range, n = 3). ***P < 0.001, Mann-Whitney U test. (D) Western blot of the indicated proteins in lysates established from CAFs infected with shRNA control (shCtr, #7 and #3) or shRNAs against ANXA6 (shANXA6-1 and shANXA6-2, #7 and #3). Quantifications are expressed as fold increase compared with CAFs infected with shCtr, n = 3. (E) Western blot of the indicated proteins following endogenous coimmunoprecipitation with nonrelevant antibody (NR) as negative control or anti-LRP1 antibody in protein lysates from CAFs infected with shCtr or shANXA6s under pathophysiologic conditions. TCL, total cell lysates. Quantifications are expressed as fold increase compared with the NR condition; data are representative of 3 independent experiments. (F) PANC-1 viability assay as in A with CAFs infected with shCtr or shANXA6s under pathophysiologic conditions (median ± interquartile range, n = 3). **P < 0.01, Mann-Whitney U test. (G) PANC-1 migration assay as in B with CAFs infected with shCtr or shANXA6s under pathophysiologic conditions (median ± interquartile range, n = 3). ***P < 0.001, Mann-Whitney U test. (H) PANC-1 adhesion assay as in C with CAFs infected with shCtr or shANXA6s under pathophysiologic conditions (median ± interquartile range, n = 3). *P < 0.05, **P < 0.01, Mann-Whitney U test. For AC and FH, data are expressed as fold increase compared with PANC-1 alone.
Figure 4
Figure 4. Impact of ANXA6 loss on PDA aggressiveness in vivo.
(A) Expression of ANXA6 in CAFs promotes pancreatic tumor growth of PANC-1. Two months after injection of cells, mice were euthanized, and cancerous pancreas dissected and weighed (median ± interquartile range; for mice injected with PANC-1, n = 16; for mice injected with PANC-1 + CAF shCtr, n = 14; for mice injected with PANC-1 + CAF shANXA6-1, n = 11; for mice injected with PANC-1 + CAF shANXA6-2, n = 11). **P < 0.01, ***P < 0.001, Mann-Whitney U test. (B) Representative micrograph of H&E-stained liver from mice coinjected with PANC-1 and shCtr CAFs0029. Dashed line delimits healthy liver (bottom) from PDA metastasis (top). (C) Western blot of the indicated proteins in lysates established from 6 orthotopic xenografts from each group obtained in A. Amido black level was used for normalization, and quantifications noted below are expressed as fold increase compared with mice #1 injected with PANC-1 alone. (D) Caspase-3+ cells numbered by immunochemistry on orthotopic xenografts obtained in A (median ± interquartile range, n = 3). *P < 0.05, **P < 0.01, Mann-Whitney U test. (E) Representative micrographs of dual immunofluorescence using caspase-3 or Ki67 staining with α-SMA or KRT19 on slides made up from orthotopic xenografts obtained by coinjection of PANC-1 and shCtr CAFs. Data are representative of 3 independent experiments. (F) Ki67+ cells numbered by immunochemistry on orthotopic xenografts obtained in A (median ± interquartile range, n = 3). *P < 0.05, **P < 0.01, Mann-Whitney U test.
Figure 5
Figure 5. CAF-derived ANXA6+ EVs enhance cancer cell aggressiveness.
(A) Western blot of the indicated proteins in total cell lysate (TCL, left panel) or high-speed pellet (HSP) extractions (right panel) established from shCtr CAFs, macrophages (M), shCtr CAFs* cocultured with macrophages, or macrophages* cocultured with shCtr CAFs. Marker specificity of each antibody used in immunoblots is labeled by *. Data are representative of 3 independent experiments. ER, endoplasmic reticulum. (B) Coimmunoprecipitation of LRP1 with ANXA6 and TSP1 in protein extracts from HSP extractions established from macrophages cocultured with shCtr CAFs or macrophages cocultured with shANXA6-1 CAFs. HSPs were used as loading control. Data are representative of 3 independent experiments (C) Graphical representation of culture protocol for measuring PANC-1 migration ability (median ± interquartile range, n = 3). *P < 0.05, **P < 0.01, Mann-Whitney U test. (D) PANC-1 migration assay as in C with HSPs from CAFs infected with shCtr or shANXA6s under physiopathologic conditions (median ± interquartile range, n = 3). **P < 0.01, Mann-Whitney U test. (E) Rescue of PANC-1 migration assay designed as in C using HSPs from CAFs infected with shCtr under physiopathologic conditions (median ± interquartile range, n = 3). *P < 0.05, **P < 0.01, ***P < 0.001, Mann-Whitney U test. (F) PANC-1 orthotopic xenografts in mice following i.p. injections of PBS (n = 7), or HSP shCtr (n = 4) or HSP shANXA6-1 (n = 8). Two months after cell injection, mice were euthanized and tumors dissected and weighed (median ± interquartile range). *P < 0.05, Mann-Whitney U test. (G) Quantification of PKH26+ PANC-1 cells after culturing for the indicated time with PKH26-stained HSPs from CAFs infected with shCtr or shANXA6s cultured under physiopathologic conditions (median ± interquartile range, n = 3). *P < 0.05, Mann-Whitney U test. (CE) Data are expressed as fold increase compared with PANC-1 alone.
Figure 6
Figure 6. ANXA6+ EVs are a biomarker for pancreatic cancer.
(A) Quantification of ANXA6+ EVs purified from serum obtained from healthy donors (n = 30, as baseline), patients with benign pancreatic disease (n = 14), patients with PDA (n = 108), and those with other cancers (n = 11) (median ± interquartile range). **P < 0.01, ***P < 0.001, Mann-Whitney U test. (B) Quantification of circulating ANXA6+ EVs obtained from healthy donors (n = 30, as baseline) and PDA patients with grade 1 (resectable, n = 18), grade 2 (nonresectable and locally advanced, n = 29), and grade 3 (n = 53, nonresectable and metastatic) (median ± interquartile range). *P < 0.05, **P < 0.01, ***P < 0.001, Wilcoxon test. (C) Kaplan-Meier overall survival curves for PDA patients with grade 1 (resectable, n = 18), grade 2 (nonresectable and locally advanced, n = 29), and grade 3 (n = 53, nonresectable and metastatic). (D) Receiver operating characteristic curve analyses of CA 19-9, with AUC = 0.928, and ANXA6, with AUC = 0.979. Analysis realized on 27 healthy donors and 78 patients with PDA. (E) Linear regression of ANXA6 versus vimentin expression level using transcriptomic analysis on patient-derived xenografts (n = 60). Dashed lines represent 95% CI. (F) Kaplan-Meier survival curve using transcriptomic analysis on patient-derived xenografts, divided into high (>373) and low (<373) ANXA6 expression groups based on the log-rank statistic test (n = 10 and n = 50, respectively). P = 0.0003. (G) Decision tree using transcriptomic analysis on patient-derived xenografts (n = 60). First node is based on ANXA6 level (>377, n = 10, or <377, n = 50), second on α-SMA level (>58.5, n = 18, or <58.5, n = 32), third on LRP1 level (>946, n = 17, or <946, n = 15).
Figure 7
Figure 7. Model of the intricate relationship between stromal and tumor cells in PDA.
Following environmental stresses, such as hypoxia and nutrient deprivation, CAFs and macrophages modify their partnership, leading to drastic changes in CAFs’ abilities. Indeed, they secrete ANXA6+ EVs, carrying a complex involving ANXA6, LRP1, and TSP1, which is necessary for EV uptake by nearby pancreatic tumor cells. Consequently to ANXA6+ EV uptake, cancer cells enhance their aggressiveness and metastatic potential. Moreover, detection of ANXA6+ EVs in sera meets stringent criteria for an efficient biomarker improving PDA prognosis and stratification.

References

    1. Brower V. Genomic research advances pancreatic cancer’s early detection and treatment. J Natl Cancer Inst. 2015;107(7):7. - PubMed
    1. Rahib L, Smith BD, Aizenberg R, Rosenzweig AB, Fleshman JM, Matrisian LM. Projecting cancer incidence and deaths to 2030: the unexpected burden of thyroid, liver, and pancreas cancers in the United States. Cancer Res. 2014;74(11):2913–2921. doi: 10.1158/0008-5472.CAN-14-0155. - DOI - PubMed
    1. Wolfgang CL, et al. Recent progress in pancreatic cancer. CA Cancer J Clin. 2013;63(5):318–348. doi: 10.3322/caac.21190. - DOI - PMC - PubMed
    1. Conroy T, et al. FOLFIRINOX versus gemcitabine for metastatic pancreatic cancer. N Engl J Med. 2011;364(19):1817–1825. doi: 10.1056/NEJMoa1011923. - DOI - PubMed
    1. Von Hoff DD, et al. Increased survival in pancreatic cancer with nab-paclitaxel plus gemcitabine. N Engl J Med. 2013;369(18):1691–1703. doi: 10.1056/NEJMoa1304369. - DOI - PMC - PubMed

Publication types

MeSH terms

Substances