. 2016 Dec 14;8(11):3301-3322.
doi: 10.1093/gbe/evw243.

LINEs between Species: Evolutionary Dynamics of LINE-1 Retrotransposons across the Eukaryotic Tree of Life

Affiliations

LINEs between Species: Evolutionary Dynamics of LINE-1 Retrotransposons across the Eukaryotic Tree of Life

Atma M Ivancevic et al. Genome Biol Evol. .

Abstract

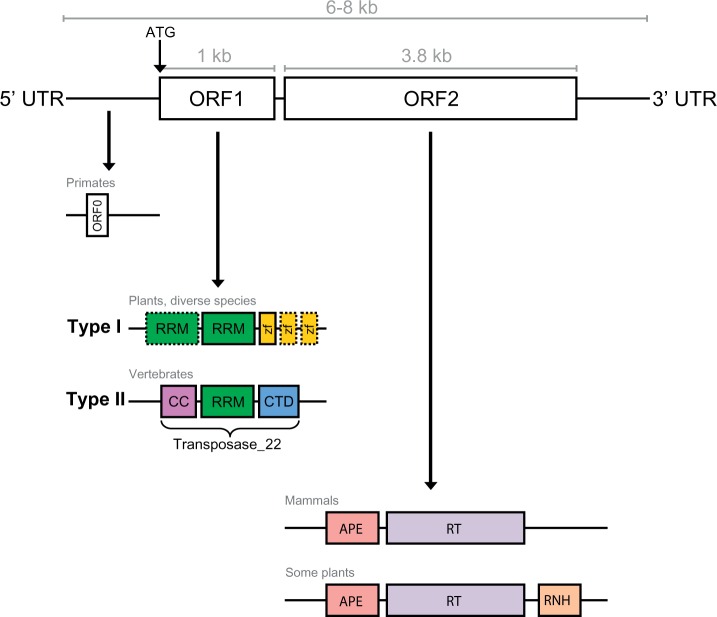
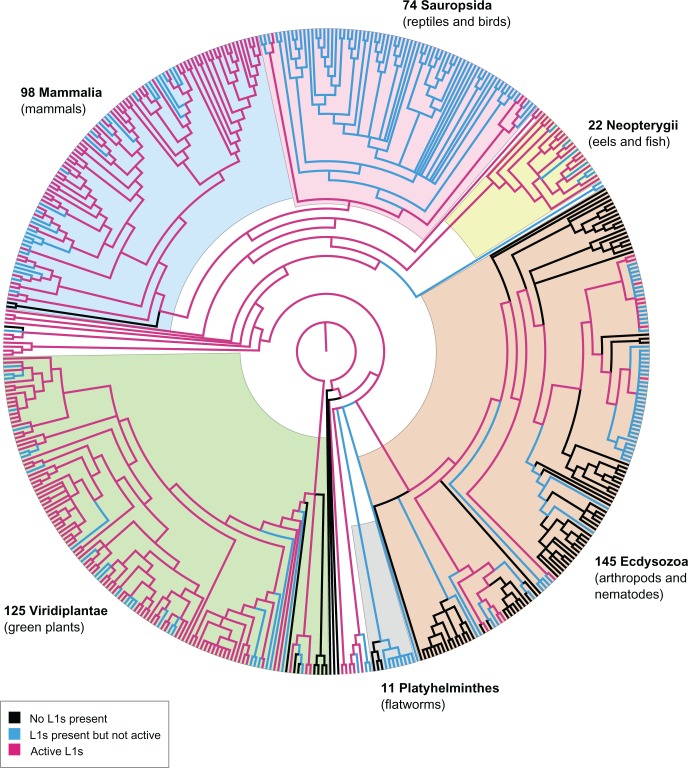
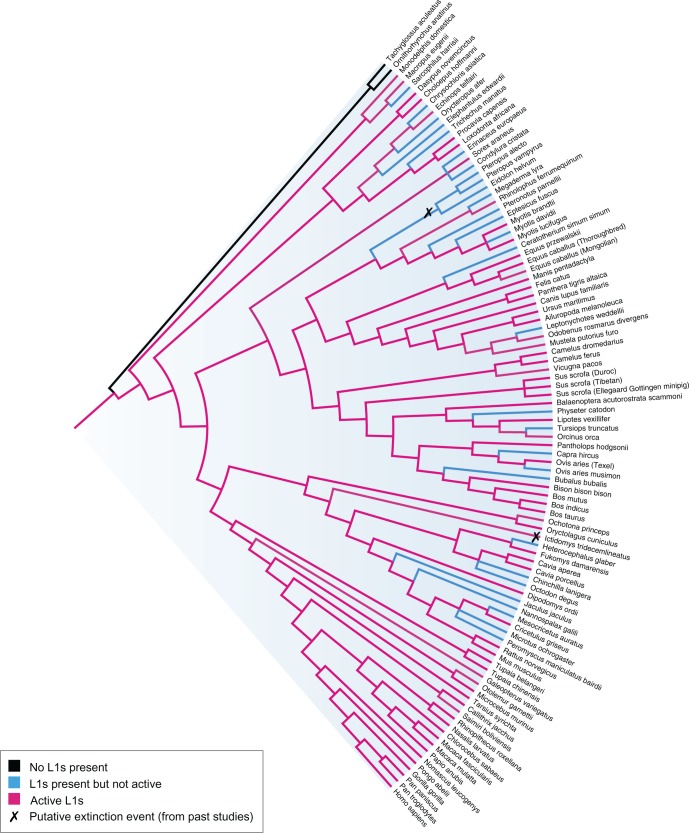
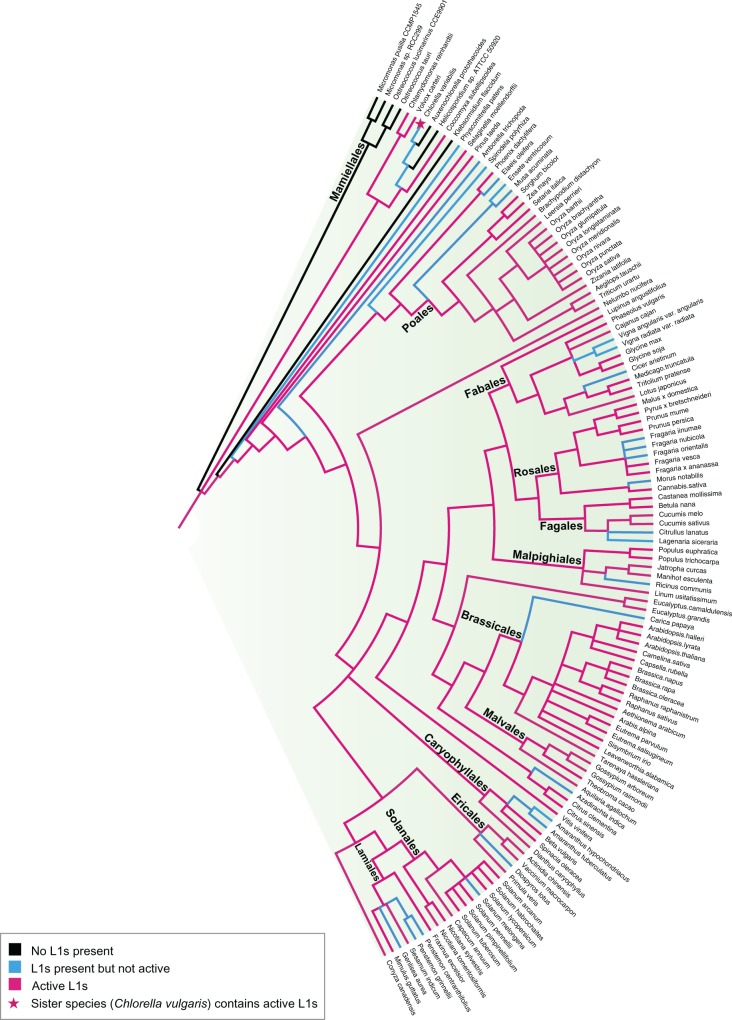
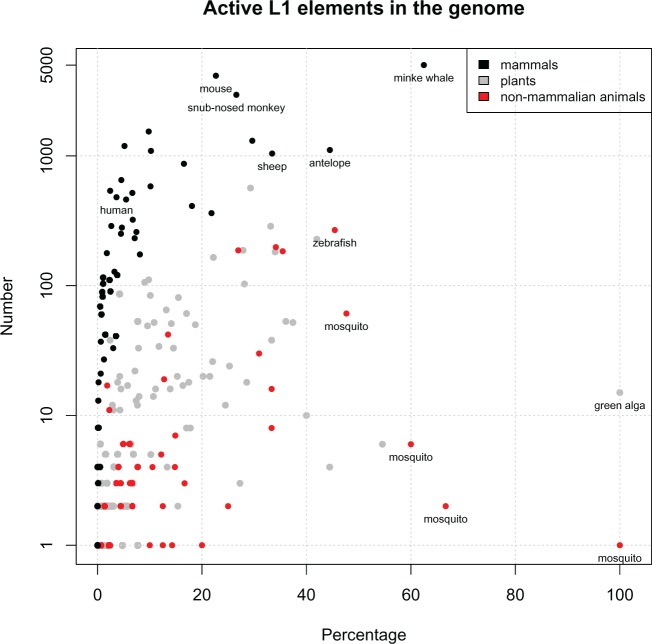
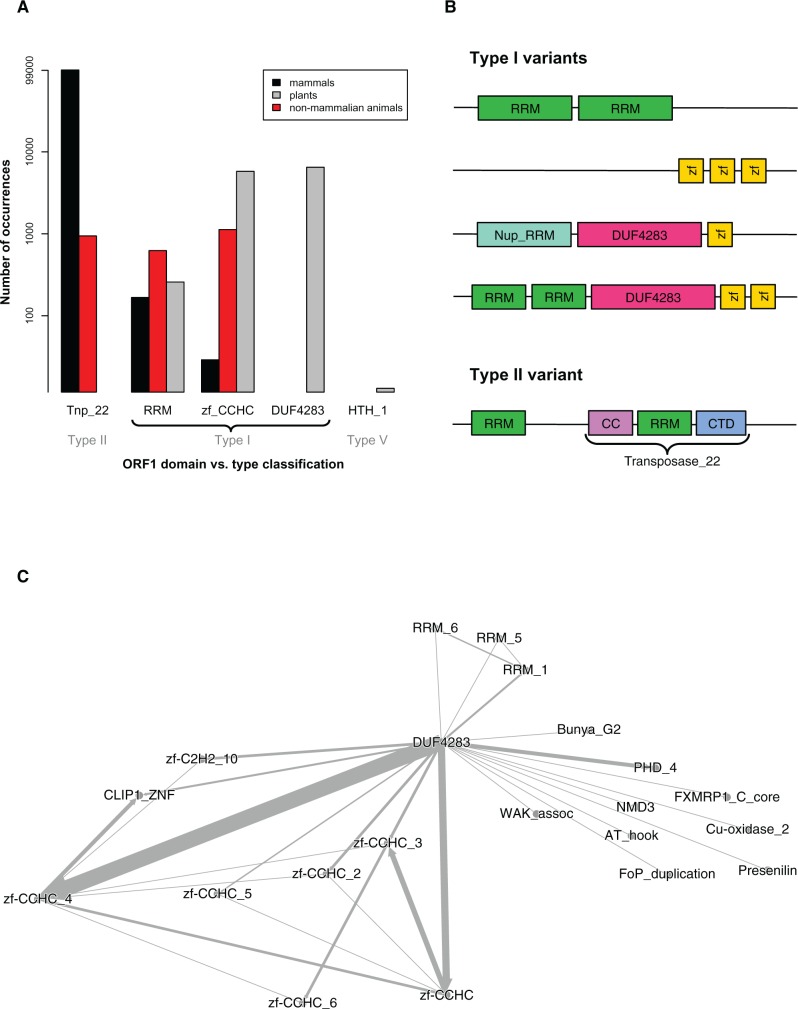
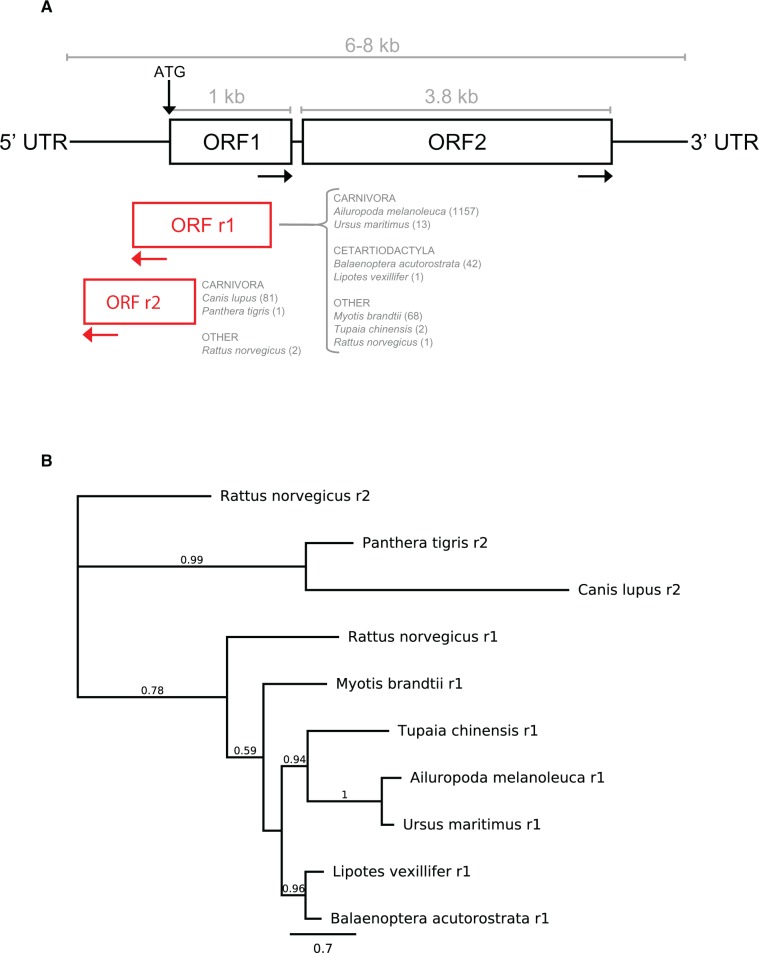
LINE-1 (L1) retrotransposons are dynamic elements. They have the potential to cause great genomic change because of their ability to 'jump' around the genome and amplify themselves, resulting in the duplication and rearrangement of regulatory DNA. Active L1, in particular, are often thought of as tightly constrained, homologous and ubiquitous elements with well-characterized domain organization. For the past 30 years, model organisms have been used to define L1s as 6-8 kb sequences containing a 5'-UTR, two open reading frames working harmoniously in cis, and a 3'-UTR with a polyA tail. In this study, we demonstrate the remarkable and overlooked diversity of L1s via a comprehensive phylogenetic analysis of elements from over 500 species from widely divergent branches of the tree of life. The rapid and recent growth of L1 elements in mammalian species is juxtaposed against the diverse lineages found in other metazoans and plants. In fact, some of these previously unexplored mammalian species (e.g. snub-nosed monkey, minke whale) exhibit L1 retrotranspositional 'hyperactivity' far surpassing that of human or mouse. In contrast, non-mammalian L1s have become so varied that the current classification system seems to inadequately capture their structural characteristics. Our findings illustrate how both long-term inherited evolutionary patterns and random bursts of activity in individual species can significantly alter genomes, highlighting the importance of L1 dynamics in eukaryotes.

Keywords: LINE; eukaryotes; evolution; retrotransposon; transposable element.


Figures

<sc>Fig</sc>. 1.—
Fig. 1.—
Conventional L1 structure and known variants. A functional L1 retrotransposon is 6–8 kb in length and contains two ORFs, both of which encode proteins for retrotransposition. ORF0 has recently been discovered in primates and is thought to facilitate retrotransposition. L1 ORF1 sequences are divided into two types: Type II is widespread throughout vertebrates, while Type I has only been found in diverse plants and non-mammalian animals such as amphibians and fish. Likewise, domain variants of ORF2 with an additional ribonuclease domain have been found in some plant species (described in the main text). UTR, untranslated region; ORF, open reading frame; RRM, RNA recognition motif; zf, gag-like Cys2HisCys zinc knuckle; CC, coiled-coil; CTD, C-terminal domain; APE, apurinic endonuclease; RT, reverse transcriptase; RNH, ribonuclease H domain.
<sc>Fig</sc>. 2.—
Fig. 2.—
Phylogenetic representation of genomic dataset. Species relationships between the 503 representative genomes used in this study were depicted using Archaeopteryx to download the Tree of Life topology for all Eukaryota (node id 3) and extract the 503 species of interest. Out-dated branches were updated using OrthoDB, OrthoMaM, NCBI Taxonomy and recent publications as references. Labels indicate the major groups present in this dataset. Branches are colored to indicate the L1 state of each genome, as shown in the legend.
<sc>Fig</sc>. 3.—
Fig. 3.—
Mammalian phylogeny reveals ubiquitous L1 presence (except for monotremes) and possible extinction events. Genomes are classified as L1 absent (L1) (black), L1 present but inactive (L1+–L1*) (blue) or L1 active (L1*) (red). Putative extinction events from past studies are marked.
<sc>Fig</sc>. 4.—
Fig. 4.—
Plant phylogeny showing the sporadic distribution of active L1 and the L1 state of each genome (colored branches). Brassicales and Poales stand out as the dominant L1* families. Orders containing more than three representative genomes are named.
<sc>Fig</sc>. 5.—
Fig. 5.—
Distribution of active L1 elements reveals several ‘hyperactive’ mammalian species. The y-axis shows the number of active L1 in the genome; the x-axis shows the percentage of active L1s in the genome (i.e. # active L1/# near full-length L1 × 100, as described in supplementary table S8, Supplementary Material online). Non-mammalian animal species (red) and plants (gray) appear to have high retrotranspositional potential but low observable L1 activity in the genome. In contrast, mammals (black) typically have a very high L1 copy number, but the majority of these are inactive. The labelled mammalian species stand out as L1 ‘hyperactive’ species because they are the most likely to be currently replicating and expanding within the genome.
<sc>Fig</sc>. 6.—
Fig. 6.—
Master lineage model predominant in most mammalian species, including snub-nosed monkey Rhinopithecus roxellana. (a) Maximum likelihood dendrogram inferred using FastTree double precision version, from full-length L1 nucleotide sequences extracted from genomic data. Sequences were clustered with UCLUST and globally aligned with MUSCLE. Species with a clearly dominant L1* cluster were classified as master lineage models, as shown in Supplementary table 9. Sequences in the alignment were tagged to indicate which ORFs were intact and visualized using Archaeopteryx. This figure highlights the ORF2-intact L1s. (b) Same as (a), but here the highlighting also shows ORF1-intact L1s and both-ORF-intact L1s. Both-ORF-intact L1s are tightly clustered on the short branches in the middle.
<sc>Fig</sc>. 7.—
Fig. 7.—
Multiple L1 lineages present in the Myotis lucifugus genome. Maximum likelihood dendrogram inferred using FastTree from full-length L1 nucleotide sequences extracted from full genome species data. As in Fig. 6, sequences were clustered with UCLUST, aligned with MUSCLE, annotated with Geneious and visualized with Archaeopteryx. Only ORF2-intact L1s are highlighted.
<sc>Fig</sc>. 8.—
Fig. 8.—
Phylogenetic analysis of RT families shows the overall hierarchy of L1/Tx1 groups. Rooted Neighbor-Joining tree based on amino acid RT domains. This tree represents the bootstrap consensus after 1,000 replicates, with nodes that have confidence values over 50% labelled. CR1 from Anopheles gambiae (outgroup) and Zepp from Chlorella vulgaris (98% identical to Coccomyxa subellipsoidea L1s) were obtained from Repbase. Only RT-families with >5 members at > 90% identity are shown in this tree. Nodes are labelled as follows: By species name if there is only one species in the family (e.g. Loxodonta africana); by genus name if there are multiple species of the same genus (e.g. Sus); by multiple genus names if there are multiple genera in the family (e.g. Ailuropoda; Ursus); and by clade name if there are more than five genera (e.g. Primates). The number in parentheses after the node name indicates the number of elements in the family.
<sc>Fig</sc>. 9.—
Fig. 9.—
ORF1p clustering and domain identification analysis. (a) ORF1p domain summary from HMM–HMM comparison. Transposase_22 (Tnp_22), RNA recognition motifs (RRM), and zinc fingers (zf-CCHC) are known ORF1p domains. The y-axis shows the number of times these appeared in each group of species (mammals, non-mammalian animals, plants), on a log scale. Several unknown domains also appeared frequently; for example, DUF4283 was found in every plant species except Coccomyxa subellipsoidea, which harboured HTH_1 ORF1 proteins instead. (b) Variants of Type I ORF1 proteins. Type I ORF1p typically has at least 1 RRM and 1 zf-CCHC; Type II ORF1p is characterized as the Transposase_22 domain. This figure highlights type variants found in the analyzed species: for example, lack of zf-CCHC motifs, seen in mosquitos; lack of RRM domains, seen in sea squirts; Nup_RRM instead of RRM, seen in some plants; over-representation of unknown DUF4283 domain in almost all plants; and an additional RRM before the Transposase_22 in some mammals, for example, bat Myotis lucifigus. Supplementary table S11, Supplementary Material online shows the ORF1p domains in each species. (c) Directed network graph of Type I ORF1 protein domains found in plants. Each ORF1p in each L1 (in each plant species) was screened using HMMer against the Pfam database. The highest-scoring domain hit was ranked first; other domains also found within that ORF1p sequence were listed next, by decreasing score. This was used to construct a network graph of the associated domains. DUF4283 was the most frequently seen, highest scoring domain – it is the centroid of the graph. RRM and zf-CCHC domains are associated with this domain (especially zf-CCHC_4), but it is the unknown domain that acts as the vital ORF1p identifier in plants.
<sc>Fig</sc>. 10.—
Fig. 10.—
Novel antisense open reading frames found in some mammals. (a) Characteristics and distribution of the antisense ORFs. The position and approximate size of the novel antisense ORFs, as well as the order/species they are found in and the number of L1s that contain this ORF (in brackets). These ORFs have no known functional domains. (b) Antisense ORFp species consensus tree. Maximum likelihood phylogeny inferred using FastTree from extracted and aligned L1 reverse ORFp consensus sequences. Expected species relationships appear preserved within the r1 and r2 clades.

References

    1. Abrusan G, Szilagyi A, Zhang Y, Papp B. 2013. Turning gold into ‘junk’: transposable elements utilize central proteins of cellular networks. Nucleic Acids Res. 41:3190–3200. - PMC - PubMed
    1. Adelson DL, Raison JM, Edgar RC. 2009. Characterization and distribution of retrotransposons and simple sequence repeats in the bovine genome. Proc Natl Acad Sci U S A. 106:12855–12860. - PMC - PubMed
    1. Adelson DL, Raison JM, Garber M, Edgar RC. 2010. Interspersed repeats in the horse (Equus caballus); spatial correlations highlight conserved chromosomal domains. Anim Genet. 41 (Suppl 2):91–99. - PubMed
    1. Altschul SF, Gish W, Miller W, Myers EW, Lipman DJ. 1990. Basic local alignment search tool. J Mol Biol. 215:403–410. - PubMed
    1. Beck CR, et al. 2010. LINE-1 retrotransposition activity in human genomes. Cell 141:1159–1170. - PMC - PubMed