. 2016 Oct 18;113(42):11901-11906.
doi: 10.1073/pnas.1613365113. Epub 2016 Oct 4.

Deep sequencing of 10,000 human genomes

Affiliations

Deep sequencing of 10,000 human genomes

Amalio Telenti et al. Proc Natl Acad Sci U S A. .

Abstract

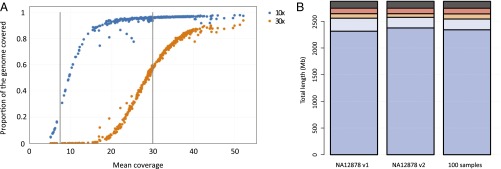
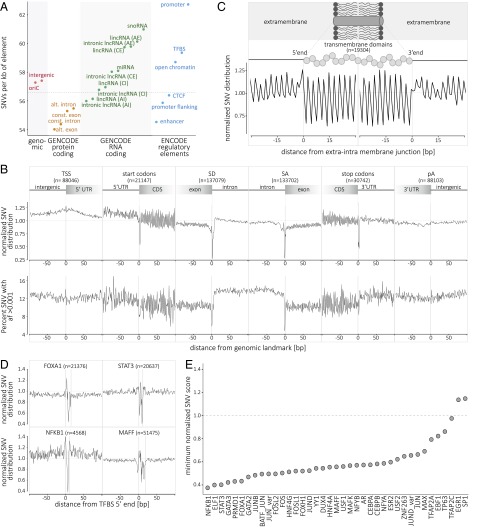
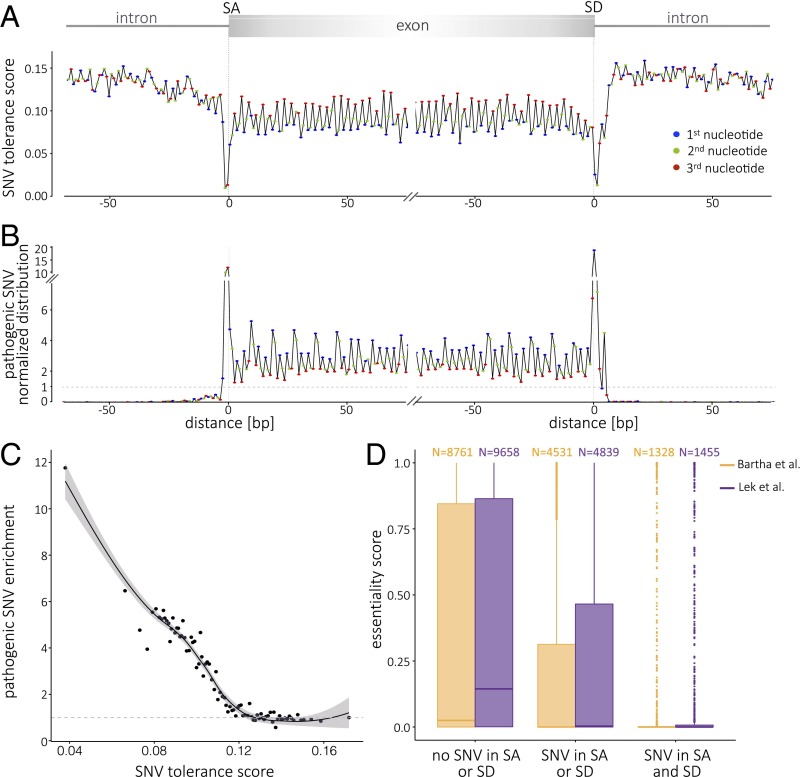
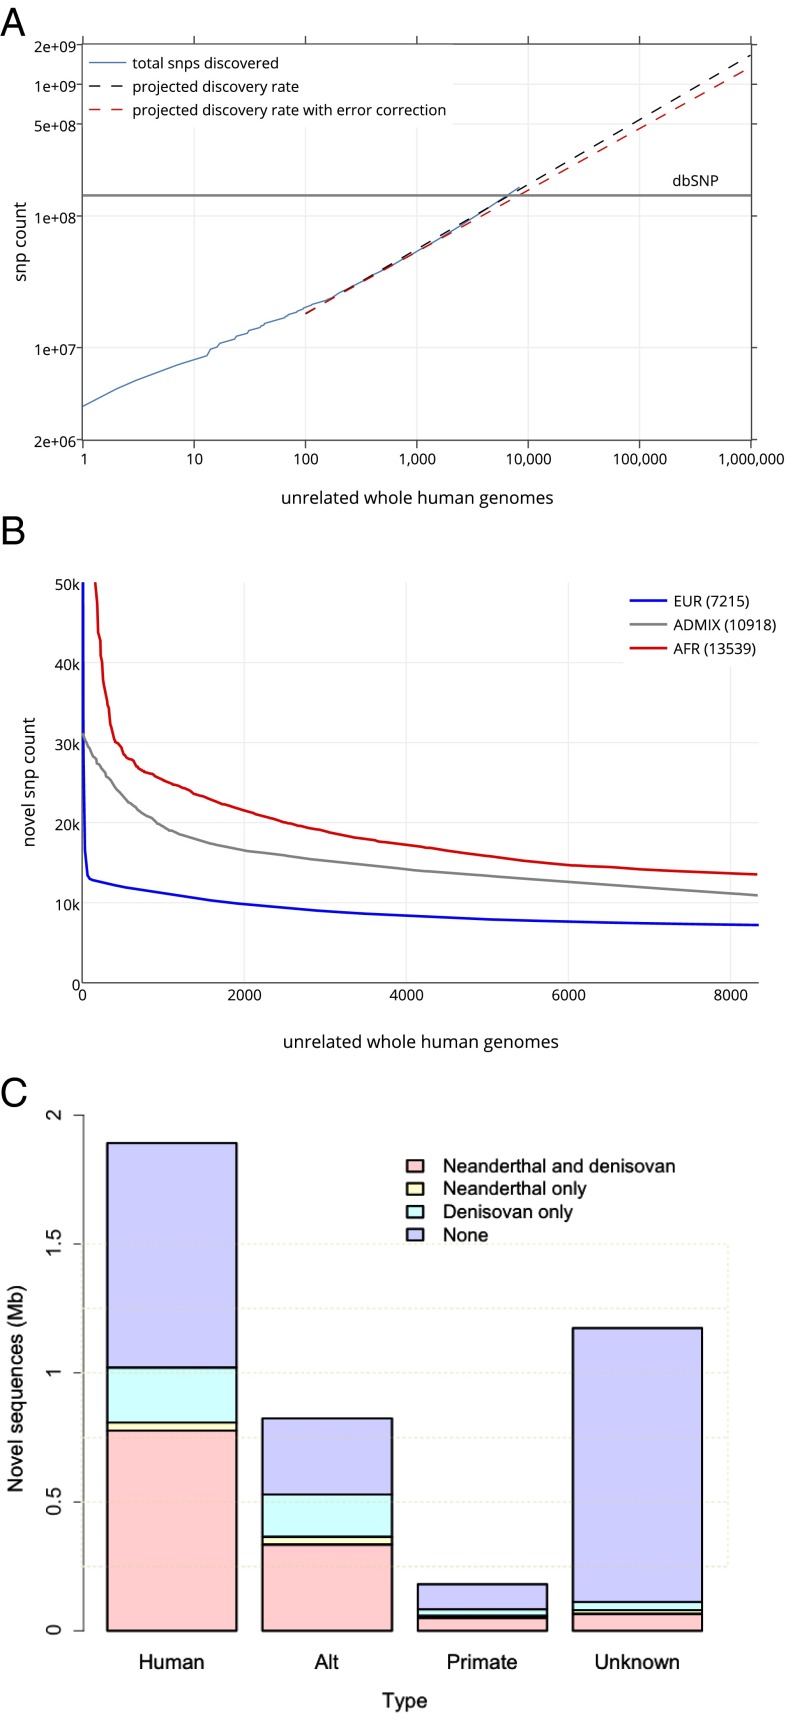
We report on the sequencing of 10,545 human genomes at 30×-40× coverage with an emphasis on quality metrics and novel variant and sequence discovery. We find that 84% of an individual human genome can be sequenced confidently. This high-confidence region includes 91.5% of exon sequence and 95.2% of known pathogenic variant positions. We present the distribution of over 150 million single-nucleotide variants in the coding and noncoding genome. Each newly sequenced genome contributes an average of 8,579 novel variants. In addition, each genome carries on average 0.7 Mb of sequence that is not found in the main build of the hg38 reference genome. The density of this catalog of variation allowed us to construct high-resolution profiles that define genomic sites that are highly intolerant of genetic variation. These results indicate that the data generated by deep genome sequencing is of the quality necessary for clinical use.

Keywords: genomics; human genetic diversity; noncoding genome.


Conflict of interest statement

The authors are employees of Human Longevity, Inc.

Figures

Fig. 1.
Fig. 1.
Effective genome coverage and sequence reproducibility. (A) Analysis of the relationship of mean coverage with effective genome coverage uses 100 NA12878 replicates with coverage <30×, 200 replicates with mean coverage 30× to 40×, and 25 replicates with coverage >40×. Vertical gray lines highlight mean target coverage of 7× and 30×. Each sequencing replicate is plotted at 10× (blue) and 30× (orange) effective minimal genome coverage. (B) Analysis of reproducibility uses NA12878 genomes at 30× to 40× mean coverage (two clustering chemistries, v1 and v2, each n = 100 replicas) to assess the consistency of base calling at each position in the whole genome. The analysis of reproducibility is then extended to 100 unrelated genomes (25 genomes per main ancestry group, African, European, and Asian, and for 25 admixed individuals). The color bars represent degree of consistency (blue, 100%; light blue, ≥90%; orange, ≥10 to <90%; red, <10%; black, failed).
Fig. 2.
Fig. 2.
Single-nucleotide variant distribution and metaprofiles in the coding and noncoding genome. (A) Distribution of SNVs in selected genomic elements (genomic, protein-coding, RNA-coding, and regulatory elements; see SI Appendix for details). The genome average of 56.59 SNVs per kb is indicated by the horizontal dashed line. (B) The metaprofiles of protein-coding genes are created by aligning all elements of six different genomic landmarks (TSS, start codon, SD, SA, stop codon, and pA) for all 10,545 genomes. The y axis (Upper) describes the enrichment/depletion of SNV occurrence per position (count score; SI Appendix, Fig. S7), normalized to the mean of the protein-coding score (indicated by the horizontal dashed line); the y axis (Lower) describes the percent of SNVs at each position with an allelic frequency higher than 1 in 1,000 (frequency score; SI Appendix, Fig. S8). The x axis represents the distance from the genomic landmark. The vertical lines indicate the genomic landmark position. The SD and SA metaprofiles highlight the strong conservation of the splice sites (Upper) and the difference in SNV allele frequency between exons and introns (Lower). (C) The metaprofile of transmembrane domains is created by aligning all single domains at their 5′ and 3′ ends. The figure highlights that every amino acid in the transmembrane domain is conserved compared with the surrounding structure of the protein. (D) The metaprofiles of TFBSs are created by aligning all of the binding sites of four transcription factors (FOXA1, STAT3, NFKB1, and MAFF) for all 10,545 genomes. The x axis represents the distance from the 5′ end of the TFBS. The vertical lines indicate the 5′ and 3′ ends of the TFBS. (E) Ranking of 39 TFBSs by conservation (minimum score for the motif; i.e., the nucleotide with the lowest tolerance to variation). For CE, the y axis describes the normalized enrichment/depletion of SNV occurrence per position, normalized to the mean of the protein-coding score (indicated by the horizontal dashed line). AE, alternative exon; AI, alternative intron; CE, constitutive exon; CI, constitutive intron; oriC, origin of replication; pA, polyadenylation site; SA, splice acceptor site; SD, splice donor site; TSS, transcription start site.
Fig. 3.
Fig. 3.
Relationship of a metaprofile tolerance score with variant pathogenicity and gene essentiality. (A) Metaprofile of the transition between introns and exons expressed as the tolerance score (TS). The TS is the product of the normalized SNV distribution value by the proportion of SNVs with allele frequency ≥0.001 (Fig. 2B). The exon sequence highlights the conservation and tolerance to variation of the third position in codons (red). The pattern of higher tolerance to variation every third nucleotide is lost in introns. The TS is lowest at the splice donor and acceptor sites and highest in introns. (B) The distribution of ClinVar and HGMD pathogenic SNVs (n = 29,808 in SD; n = 30,369 in SA metaprofiles) reflects a significant enrichment of pathogenic variants at the sites of lowest TS. Consistently, the exon sequence highlights the enrichment for variation at the first position in codons (blue), as it results in amino acid change or truncation. (C) Relationship of tolerance score and enrichment for pathogenic variants. Represented on the x axis are the mean TS values for the coding region (±10 bp of intergenic or intronic boundaries); each dot represents the mean of 10 positions. The y axis represents the fold enrichment in pathogenic variants. local regression (LOESS) curve fitting is represented by the solid line; the shaded area indicates the 95% confidence interval. (D) Less essential genes tolerate variation at sites with lowest TS values. The x axis represents three different classes of genes according to their having evidence for splice acceptor/donor variation. The y axis represents essentiality scores of Bartha et al. (21) (yellow) and Exome Aggregation Consortium (ExAC) pLI (probability that a gene is intolerant to a loss of function mutation) (22) (purple). The large majority of genes that tolerate splice-site variants are not essential; in contrast, there is a marked shift to higher essentiality values for genes that are not observed to be variant at the splice sites.
Fig. 4.
Fig. 4.
Novel variants and genome sequences. (A) SNV discovery rate for 8,096 unrelated individual genomes contributing over 150 million SNVs (blue line). The projection for discovery rates as more genomes are sequenced is represented without (dashed black line) and with correction for the empirical false discovery rate of 0.0025 (dashed orange line). The number of SNVs in dbSNP is represented by the horizontal gray line. (B) The number of newly observed variants as more individuals are sequenced is determined by the ancestry background and number of participants in the study. Shown are the rates of identification of novel variants for each additional African genome (13,539 SNVs) and for each additional genome of admixed individuals (10,918 SNVs). The most numerous population in the study, Europeans, contributes the lowest number of novel variants (7,215 SNVs). (C) Unmapped sequence from the analysis of 8,096 unrelated individual genomes contributing over 3.2 Mb of nonreference genome. The 4,876 unique nonreference contigs had matches in the NCBI nt database as human, or nonhuman primate, and with hominins. There are contigs with human-like features that do not have a known match in databases.

Comment in

References

    1. Walter K, et al. UK10K Consortium The UK10K project identifies rare variants in health and disease. Nature. 2015;526(7571):82–90. - PMC - PubMed
    1. Genome of the Netherlands Consortium Whole-genome sequence variation, population structure and demographic history of the Dutch population. Nat Genet. 2014;46(8):818–825. - PubMed
    1. Auton A, et al. 1000 Genomes Project Consortium A global reference for human genetic variation. Nature. 2015;526(7571):68–74. - PMC - PubMed
    1. Gudbjartsson DF, et al. Large-scale whole-genome sequencing of the Icelandic population. Nat Genet. 2015;47(5):435–444. - PubMed
    1. Gurdasani D, et al. The African Genome Variation Project shapes medical genetics in Africa. Nature. 2015;517(7534):327–332. - PMC - PubMed

Substances