. 2016 Oct 18;113(42):E6372-E6381.
doi: 10.1073/pnas.1608198113. Epub 2016 Oct 4.

Label-free imaging of the native, living cellular nanoarchitecture using partial-wave spectroscopic microscopy

Affiliations

Label-free imaging of the native, living cellular nanoarchitecture using partial-wave spectroscopic microscopy

Luay M Almassalha et al. Proc Natl Acad Sci U S A. .

Abstract

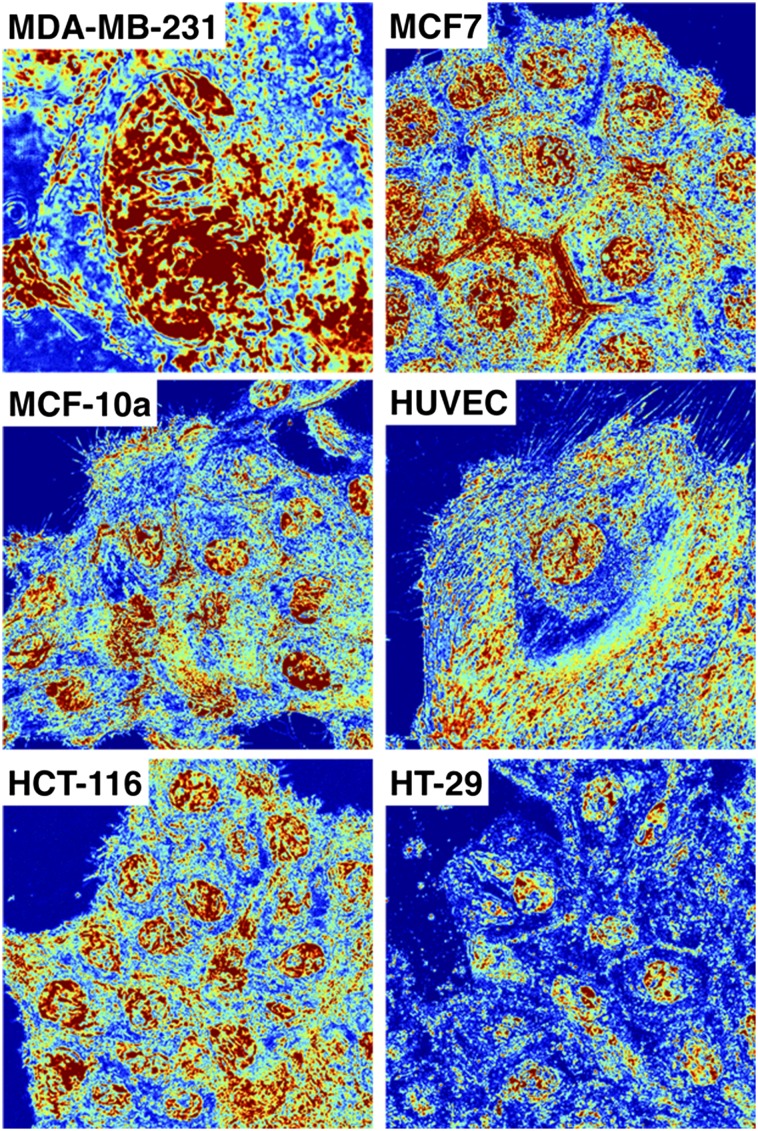
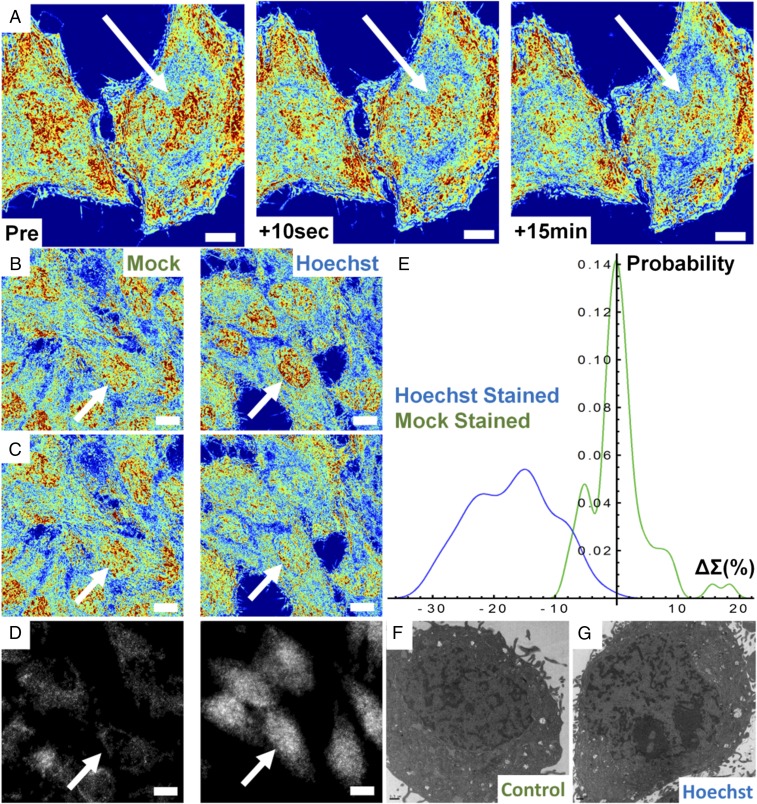
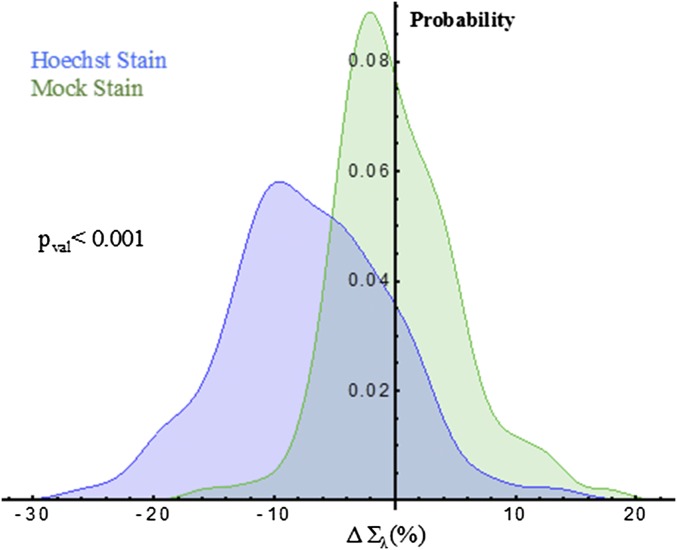
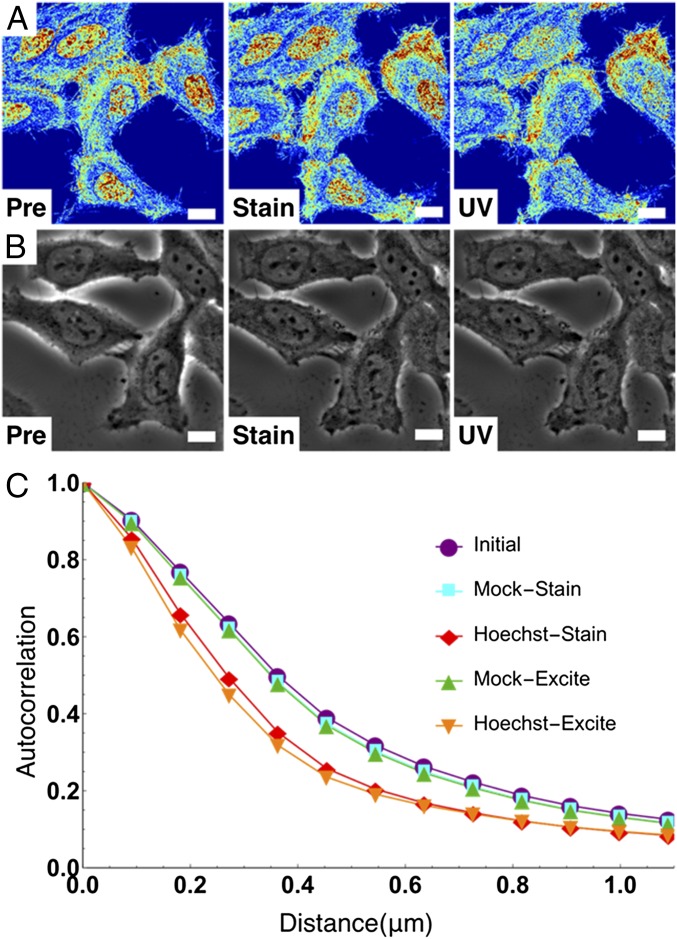
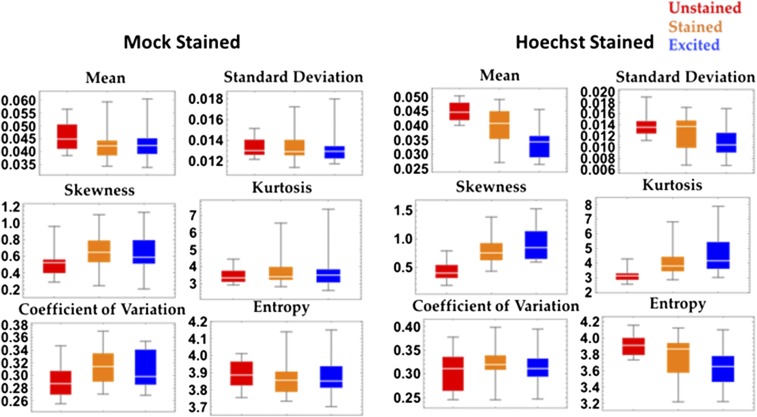
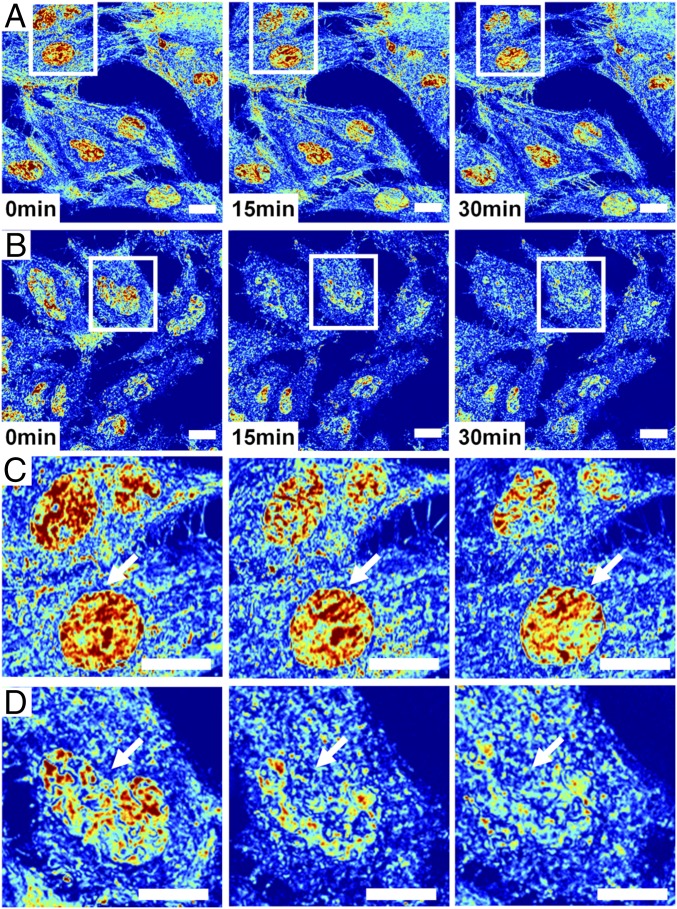
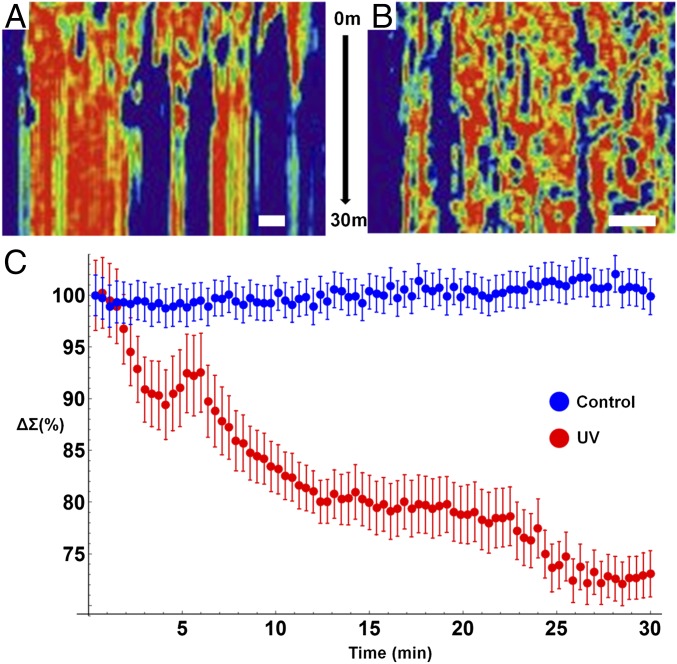
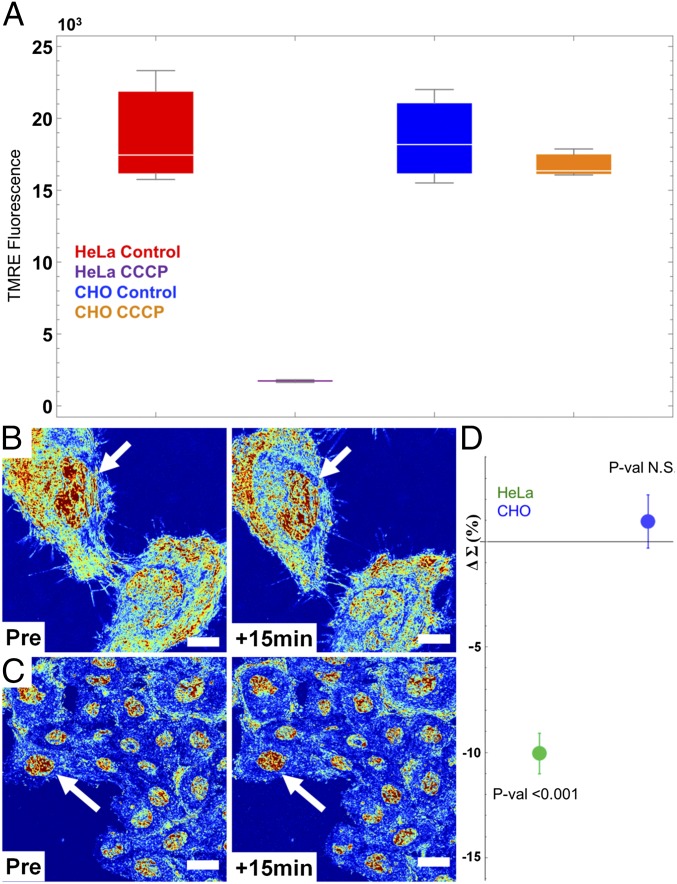
The organization of chromatin is a regulator of molecular processes including transcription, replication, and DNA repair. The structures within chromatin that regulate these processes span from the nucleosomal (10-nm) to the chromosomal (>200-nm) levels, with little known about the dynamics of chromatin structure between these scales due to a lack of quantitative imaging technique in live cells. Previous work using partial-wave spectroscopic (PWS) microscopy, a quantitative imaging technique with sensitivity to macromolecular organization between 20 and 200 nm, has shown that transformation of chromatin at these length scales is a fundamental event during carcinogenesis. As the dynamics of chromatin likely play a critical regulatory role in cellular function, it is critical to develop live-cell imaging techniques that can probe the real-time temporal behavior of the chromatin nanoarchitecture. Therefore, we developed a live-cell PWS technique that allows high-throughput, label-free study of the causal relationship between nanoscale organization and molecular function in real time. In this work, we use live-cell PWS to study the change in chromatin structure due to DNA damage and expand on the link between metabolic function and the structure of higher-order chromatin. In particular, we studied the temporal changes to chromatin during UV light exposure, show that live-cell DNA-binding dyes induce damage to chromatin within seconds, and demonstrate a direct link between higher-order chromatin structure and mitochondrial membrane potential. Because biological function is tightly paired with structure, live-cell PWS is a powerful tool to study the nanoscale structure-function relationship in live cells.

Keywords: DNA damage; cell dynamics; chromatin; microscopy; mitochondrial metabolism.


Conflict of interest statement

V.B., H.S., and H.K.R. are cofounders of Nanocytomics, LLC.

Figures

Fig. S1.
Fig. S1.
Schematic diagram of the live-cell PWS microscope. The live-cell PWS microscope was built onto a commercial Leica DMIRB microscope equipped with a broadband illumination source (xenon lamp or an LED). Monochromatic spectral collection was performed using a LCTF and a camera to yield a 3D image cube containing spatial coordinates and spectral information.
Fig. 1.
Fig. 1.
Live-cell PWS rapidly provides quantitative nanoscale structural information of living cells. (A and B) Orthographic z-axis projection of molecular dynamics simulations of chromatin as a 10-nm “beads on a string” polymer capturing (A) differentially compacted (lc = 70 nm) and (B) diffusely compacted chromatin (lc = 20 nm). (Scale bar: 100 nm.) (C and D) Calculated transmission microscope image captured by (C) conventional bright-field microscope from differentially compacted chromatin in A and D of diffusely compacted chromatin in B. Images were produced by calculating the average mass density at each pixel, and a Gaussian PSF of 250 nm was applied to simulate a conventional microscope. Grid size of the simulations was 10 nm. (E and F) Calculation of Σ captured by live-cell PWS from differentially compacted chromatin in A and diffusely compacted chromatin in B. Σ was calculated directly from the distribution of mass within configurations shown in A and B with Σ = 0.01–0.065. (G) Representative pseudocolored live-cell PWS image of HeLa cells with 63× oil-immersion lens, N.A. = 1.4 with Σ scaled to range between 0.0125 and 0.065. (H) Colocalization of fluorescence with live-cell PWS image showing mitochondria (green), nuclei (dark blue), and mitochondria–nucleus overlap (light blue). (Scale bar: 20 µm.) (I and J) Representative pseudocolored live-cell PWS image of (I) HeLa cells and (J) Mes-SA cells demonstrating the capacity to capture nanoscopic information from dozens of nuclei in seconds with Σ scaled to range between 0.01 and 0.05 in I and 0.01 and 0.065 in J.
Fig. S2.
Fig. S2.
FDTD simulations of live-cell PWS microscope. FDTD simulations of light scattering through three layers of media with a collection N.A. of 1.25. The first layer is glass with constant refractive index (RI) of 1.53; the second layer represents a cell with randomized RI (mean of 1.38, SD of 0.04); the third layer is media with constant RI of 1.33. At deeply subdiffractional length scales, ∑ increases proportionally with the correlation length (Lc). Inset represents full range of subdiffractional Lc present within cells. Error bars are SD.
Fig. S3.
Fig. S3.
Analysis of numerical aperture on spectral interference (∑) signal. A variable 63× oil objective was used to measure the effect of numerical aperture (N.A.) on in the nuclei of HeLa cells. A reference signal was collected for both the low-N.A. (0.6) and high-N.A. (1.4) configurations. The same cells were directly imaged using both N.A. configurations (n = 62 from two independent experiments over 12 fields of view) and were collected successively in under a minute to minimize temporal variations in structure.
Fig. S4.
Fig. S4.
Comparison of live-cell PWS images (Left) with wide-field fluorescence of nuclei (Right). Live-cell PWS microscopy allows identification of nuclei due to the intrinsic differences in the structure between the nucleus and the cytoplasm. ∑ scaled between 0.2 and 0.65. (Scale bar: 15 μm.)
Fig. S5.
Fig. S5.
Full spectral acquisition of live-cell PWS for six cell lines. Live-cell PWS microscopy allows direct analysis of the nanoscopic topology of a wide range of eukaryotic cell line models. In addition to the ubiquitously used cell lines used in the main manuscript (HeLa and CHO cells), additional classical models of breast cancer (MDA-MB-231, MCF-7, MCF-10a), colon (HT-29, HCT116), and even primary human cell lines (HUVECs) can all be imaged without the need for fluorescent transfection or small-molecule exogenous dyes. ∑ scaled between 0.01 and 0.065 in all cells except MDA-MB-231, which is called from 0.01 to 0.1.
Fig. 2.
Fig. 2.
Hoechst excitation induces rapid transformation of chromatin nanoarchitecture. (A) Pseudocolored live-cell PWS image of Hoechst 33342-stained HeLa cells before and after excitation of the dye with UV light. Transformation of chromatin occurs across the whole nucleus within seconds and no repair is observed even after 15 min. (B) Hoechst-stained and M-S cells before excitation and (C) the same M-S and Hoechst-stained cells after UV irradiation. (D) Minimal (mock) and significant (Hoechst) γH2A.X antibody accumulation. (E) Distribution of chromatin transformation after UV excitation for Hoechst-stained and M-S cells. (F and G) Transmission electron-microscopic images of control and Hoechst-stained cells confirming nanoscale fragmentation of the chromatin nanoarchitecture in fixed cells. All pseudocolored images scaled between Σ = 0.01 and 0.065. (All scale bars: 15 µm.) Arrows indicate representative nuclei.
Fig. S6.
Fig. S6.
UV excitation of Hoechst 33342 in Chinese hamster ovarian (CHO) cells. Distribution of nuclear transformation (ΔPost-Pre irradiation) after UV excitation for mock-stained (green) and Hoechst-stained (blue) CHO cells. As with HeLa cells, CHO cell nuclei demonstrate a decrease in signal immediately after irradiation in the Hoechst-stained cells.
Fig. 3.
Fig. 3.
Live-cell PWS uniquely detects nanoarchitectural transformation resulting from Hoechst incubation and excitation. (A and B) Live-cell PWS (A) and phase contrast (B) cells preincubation, 15-min postincubation, Hoechst fluorescent image, and after excitation. (C) Change in the autocorrelation function of live-cell PWS intensity. Hoechst transforms chromatin into a more globally heterogeneous structure. Live-cell PWS images are scaled between Σ = 0.01 and 0.065. (All scale bars: 15 µm.)
Fig. S7.
Fig. S7.
Distribution statistics for Hoechst-stained cells. The effect of Hoechst staining on the statistical properties of the nanoarchitecture as measured by ∑ within cell nuclei between mock-stained and Hoechst-stained cells. In addition to altering the mean nuclear ∑, Hoechst staining and its excitation causes changes in the distribution of possible nuclear states. In particular, Hoechst staining increases the skewness and the kurtosis while decreasing the image entropy.
Fig. 4.
Fig. 4.
Live-cell PWS detects dynamics of nanoarchitectural transformation under normal and UV-irradiated conditions. (A) Representative field of view displaying seven HeLa cells imaged in ∼15 s using a 63× oil-immersion lens, N.A. = 1.4, with Σ scaled to range between 0.01 and 0.065 over 30 min of imaging. (B) Representative field of view displaying seven HeLa cells exposed continuously to UV light imaged in ∼22 s using a 63× oil-immersion lens, N.A. = 1.4, with Σ scaled to range between 0.01 and 0.065 over 30 min of imaging. (C) Inset from field of view in A showing the time evolution of two nuclei. Interestingly, chromatin organization is rapidly evolving in time, showing that, even at steady state, the underlying structure changes. (D) Inset from field of view in B showing the time evolution of one nucleus under UV illumination. Under UV exposure, homogeneous micrometer-scale domains form within chromatin, lacking their original higher-order structure. Arrows indicate representative nuclei.
Fig. 5.
Fig. 5.
Live-cell PWS detects dynamics of nanoarchitectural transformation under normal and UV-irradiated conditions. (A) Kymograph (with the x axis representing a linear cross-section in x–y plane and the y axis showing changes over time) representing the temporal evolution of chromatin of a cell exposed to continuous UV light. Interestingly, nanoscopically homogenous, micrometer-scale domains form within the nucleus after ∼5 min of exposure with an overall arrest in structural dynamics. (B) Kymograph representing the temporal evolution of chromatin of a cell under normal conditions. Under normal conditions, the nanoscale topology of chromatin is highly dynamic, with continuous transitions in structure occurring throughout the nucleus. (C) Quantitative analysis of nanoscale structure of chromatin of cells under normal conditions (blue, n = 32 cells from two replicates) and exposed to UV light (red, n = 19 cells from three replicates) for 30 min. Exposure to UV light induces overall homogenization of chromatin nanoarchitecture within minutes. Error bars represent SE. (Scale bar: 5 µm.)
Fig. 6.
Fig. 6.
Mitochondrial membrane potential (ΔΨm) is a direct, rapid regulator of chromatin compaction. (A) Flow cytometry showing a 10-fold decrease in HeLa cell TMRE fluorescence after 10 μM CCCP treatment (P < 0.015) and no significant change in CHO cell fluorescence. (B) HeLa and (C) CHO cells before and 15 min after CCCP treatment. (D) Quantification of the nuclear nanoarchitecture change in HeLa and CHO cells before and after treatment (HeLa = 31 cells, six replicates; CHO = 159 cells, five replicates) with SE bars. Depletion of ΔΨm induces decompaction and homogenization of HeLa but not CHO chromatin. Live-cell PWS images are scaled between Σ = 0.01 and 0.065. (All scale bars: 15 µm.) Arrows indicate representative nuclei.

References

    1. Klar TA, Jakobs S, Dyba M, Egner A, Hell SW. Fluorescence microscopy with diffraction resolution barrier broken by stimulated emission. Proc Natl Acad Sci USA. 2000;97(15):8206–8210. - PMC - PubMed
    1. Rust MJ, Bates M, Zhuang X. Sub-diffraction-limit imaging by stochastic optical reconstruction microscopy (STORM) Nat Methods. 2006;3(10):793–795. - PMC - PubMed
    1. Betzig E, et al. Imaging intracellular fluorescent proteins at nanometer resolution. Science. 2006;313(5793):1642–1645. - PubMed
    1. Jing C, Cornish VW. Chemical tags for labeling proteins inside living cells. Acc Chem Res. 2011;44(9):784–792. - PMC - PubMed
    1. Lelek M, et al. Superresolution imaging of HIV in infected cells with FlAsH-PALM. Proc Natl Acad Sci USA. 2012;109(22):8564–8569. - PMC - PubMed

Publication types