. 2016 Oct 18;113(42):11943-11948.
doi: 10.1073/pnas.1607601113. Epub 2016 Oct 4.

Predictability and hierarchy in Drosophila behavior

Affiliations

Predictability and hierarchy in Drosophila behavior

Gordon J Berman et al. Proc Natl Acad Sci U S A. .

Abstract

Even the simplest of animals exhibit behavioral sequences with complex temporal dynamics. Prominent among the proposed organizing principles for these dynamics has been the idea of a hierarchy, wherein the movements an animal makes can be understood as a set of nested subclusters. Although this type of organization holds potential advantages in terms of motion control and neural circuitry, measurements demonstrating this for an animal's entire behavioral repertoire have been limited in scope and temporal complexity. Here, we use a recently developed unsupervised technique to discover and track the occurrence of all stereotyped behaviors performed by fruit flies moving in a shallow arena. Calculating the optimally predictive representation of the fly's future behaviors, we show that fly behavior exhibits multiple time scales and is organized into a hierarchical structure that is indicative of its underlying behavioral programs and its changing internal states.

Keywords: Drosophila; behavior; hierarchy; information bottleneck.


Conflict of interest statement

The authors declare no conflict of interest.

Figures

Fig. 1.
Fig. 1.
Transition probabilities and behavioral modularity. (A) Behavioral space probability density function (PDF). Here, each peak in the distribution corresponds to a distinct stereotyped movement. (B) One-step Markov transition probability matrix T(τ=1). The 117 behavioral states are grouped by applying the predictive information bottleneck calculation and allowing six clusters (Eq. 4). Black lines denote the cluster boundaries. (C) Transitions rates plotted on the behavioral map. Each red point represents the maximum of the local PDF, and the black lines represent the transition probabilities between the regions. Line thicknesses are proportional to the corresponding value of T(τ=1)ij, and right-handed curvature implies the direction of transmission. For clarity, all lines representing transition probabilities of less than 0.05 are omitted. (D) The clusters found using the information bottleneck approach (colored regions) are contiguous in the behavioral space. Behavioral labels associated with each partitioned graph cluster from B are shown. Black line thicknesses represent the conditional transition probabilities between clusters. All transition probabilities less than 0.05 are omitted.
Fig. 2.
Fig. 2.
Long time scale transition matrices and non-Markovian dynamics. (A) Markov model transition matrix for τ=100, TM(100), from Eq. 3. (B and C) Transition matrices for τ=100 and τ=1,000, respectively, from Eq. 1. (D) Absolute values of the leading eigenvalues of the transition matrices T(τ) as a function of τ. The curves represent the average over all flies, and thicknesses represent the SEM. Dashed lines are the predictions for the Markov model TM(τ). The black line is a noise floor, corresponding to the typical value of the second largest eigenvalue in a transition matrix calculated from random temporal shuffling of our finite data set. (E) Eigenmode decay rates, rmu(τ)log|λμ(τ)|/τ, as a function of the number of transitions. Line colors represent the same modes as in D and the black line again corresponds to a “noise floor,” in this case, the largest decay rate that we can resolve above the random structures present in our finite sample.
Fig. 3.
Fig. 3.
Optimal trade-off curves for lags from τ=1 to τ=5,000. For each time lag τ, number of clusters, and β, we optimize Eq. 4 and plot the resulting complexity of the partitioning, I(Z;S(n)), vs. the predictive information, I(Z;S(n+τ)).
Fig. 4.
Fig. 4.
Information bottleneck partitioning of behavioral space for τ=67 (approximately twice the longest time scale in the Markov model). Borders from the previous partitions are shown in black. For 25 clusters (Bottom Right), the partitions, still contiguous, are denoted by dashed lines.
Fig. 5.
Fig. 5.
Hierarchical organization for optimal solutions with lag τ=100 ranging from 1 cluster to 25. The displayed clusterings are those that have the largest value of I(Z;S(n+τ)) for that number of clusters. The length of the vertical bars are proportional to the percentage of time a fly spends in each of the clusters, and the lines flowing horizontally from left to right are proportional in thickness to the flux from the clustering on the left to the clustering on the right. Fluxes less than 0.01 are suppressed for clarity.
Fig. 6.
Fig. 6.
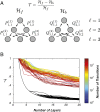
Partitionings are tree-like over all measured time scales. (A) Definition of the treeness metric, T; see Materials and Methods for details. (B) T as a function of the number of transitions in the future and the number of clusters in the most fine-grained partition. Colored lines represent values of T for partitions at varying times in the future, and black lines are values for randomized graphs generated from partitionings that were assigned randomly.

References

    1. Tinbergen N. The Study of Instinct. Oxford Univ Press; Oxford, UK: 1951.
    1. Dawkins R. In: Hierarchical Organization: A Candidate Principle for Ethology in Growing Points in Ethology. Bateson P, Hinde R, editors. Cambridge Univ Press; Cambridge, UK: 1976. pp. 7–54.
    1. Simon HA. The architecture of complexity. Proc Am Philos Soc. 1962;106(6):467–482.
    1. Dawkins R, Dawkins MS. Hierarchical organization and postural facilitation: Rules for grooming in flies. Anim Behav. 1976;24(4):739–755.
    1. Seeds AM, et al. A suppression hierarchy among competing motor programs drives sequential grooming in Drosophila. eLife. 2014;3:e02951. - PMC - PubMed

Publication types

LinkOut - more resources