. 2016 Oct 25;113(43):E6630-E6638.
doi: 10.1073/pnas.1608820113. Epub 2016 Oct 4.

Architecture of a minimal signaling pathway explains the T-cell response to a 1 million-fold variation in antigen affinity and dose

Affiliations

Architecture of a minimal signaling pathway explains the T-cell response to a 1 million-fold variation in antigen affinity and dose

Melissa Lever et al. Proc Natl Acad Sci U S A. .

Erratum in

Abstract

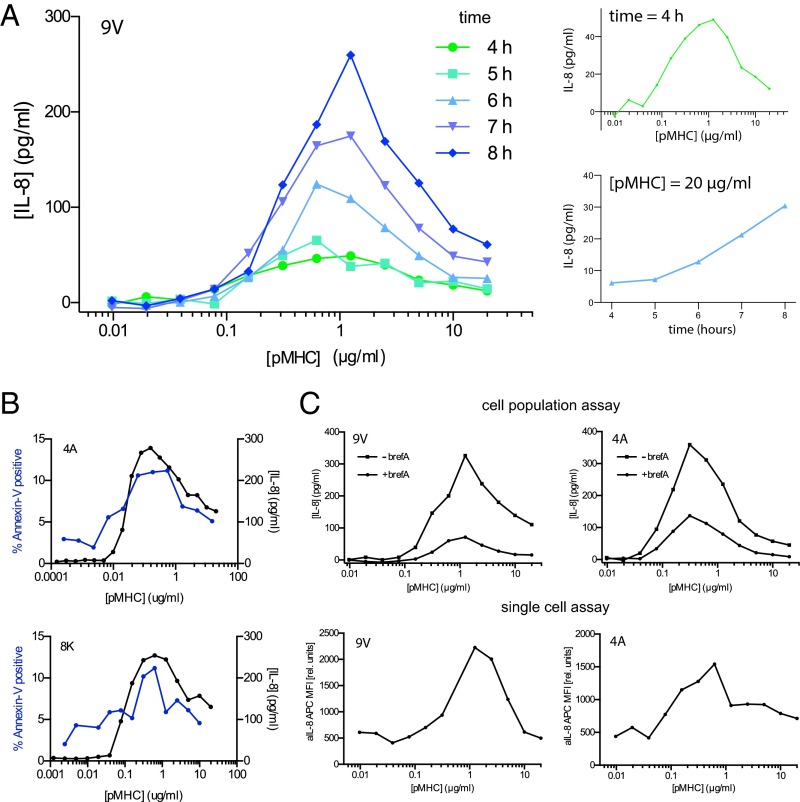
T cells must respond differently to antigens of varying affinity presented at different doses. Previous attempts to map peptide MHC (pMHC) affinity onto T-cell responses have produced inconsistent patterns of responses, preventing formulations of canonical models of T-cell signaling. Here, a systematic analysis of T-cell responses to 1 million-fold variations in both pMHC affinity and dose produced bell-shaped dose-response curves and different optimal pMHC affinities at different pMHC doses. Using sequential model rejection/identification algorithms, we identified a unique, minimal model of cellular signaling incorporating kinetic proofreading with limited signaling coupled to an incoherent feed-forward loop (KPL-IFF) that reproduces these observations. We show that the KPL-IFF model correctly predicts the T-cell response to antigen copresentation. Our work offers a general approach for studying cellular signaling that does not require full details of biochemical pathways.

Keywords: T-cell receptor; immunology; pathway architecture; signaling; systems biology.


Conflict of interest statement

The authors declare no conflict of interest.

Figures

Fig. 1.
Fig. 1.
T-cell activation in response to a 1 million-fold variation in pMHC affinity and dose. (A) Schematic illustrating that the signaling architecture linking the TCR to cytokine production is unknown. (B) Affinities (displayed as dissociation constants, Kd) and (C) kinetics of the c58c61 TCR interacting with 11 pMHC ligands determined using surface plasmon resonance (see also SI Appendix, Fig. S1 and Table S1). T-cell activation as measured by supernatant (D) IFN-γ and (E) MIP-1β in primary T cells after 4 h and (F) IL-8 in Jurkat T cells after 16 h transduced with the c58c61 TCR (insets show the three lowest-affinity ligands in each experiment). Ligand color scheme is identical across all panels. Additional data, including additional concentrations, additional ligands, pMHC immobilization controls, and TCR expression levels, are summarized in SI Appendix, Fig. S2.
Fig. 2.
Fig. 2.
A bell-shaped dose–response is a consequence of reduced cytokine production at high pMHC concentrations. (A) T-cell activation dose–response curves at the indicated time points (Left) highlighting the bell-shape at early times (4 h) and continued cytokine production at the largest pMHC concentration (Right, Top and Bottom). (B) Percent of T cells positive for annexin V (blue, left axis) determined at the end of a 16-h functional assay where the supernatant concentration of IL-8 was also determined (black, right axis). (C) Comparison of supernatant IL-8 production at the population level (Top) with the corresponding single cell IL-8 production by flow cytometry (Bottom) at 16 h. Brefeldin A was added to block cytokine secretion for the last 3 h of the assay (reducing supernatant cytokine in the cell population assay). Jurkat T cells are used to generate all panels with the indicated pMHC ligands. See SI Appendix, Fig. S2E for single-cell cytokine production in primary CD8+ T cells.
Fig. 3.
Fig. 3.
Sequential model rejection reveals that kinetic proofreading with limited signaling coupled to an incoherent feed-forward loop can produce all phenotypic features. The models considered, in order of increasing complexity, are (A) occupancy, (B) occupancy coupled to incoherent feed-forward, (C) kinetic proofreading coupled to incoherent feed-forward, and (D) KPL-IFF. All models include the reversible (serial) binding of pMHC ligands (L) to the TCR (R) to form complexes that can regulate the activation of a protein P that is taken to be a measure of T-cell activation. See SI Appendix for computational details and SI Appendix, Applet S1 for a tool that can be used to explore how the five parameters in the KPL-IFF model (kp, ϕ, μ, λ, and δ) modulate the predicted dose–response for antigens of different affinities.
Fig. 4.
Fig. 4.
Systematic analyses of signaling models reveals that the KPL-IFF mechanism is unique. (A) To determine whether other models of equal (or lower) complexity to the KPL-IFF model (Fig. 3D) are able to produce all phenotypic features we performed a systematic search of 304 network architectures with three reaction arrows between the receptor states (C0, C1, and C2), Y, and P. The only network architecture that is able to produce all phenotypic features is the KPL-IFF model (Movie S1). Conversely, (B) the mirrored KPL-IFF, (C) the redirected KPL-IFF, and (D) negative feedback network architectures are unable to produce the phenotypic features. (E) To determine whether more complex models can reproduce the phenotypic features using mechanisms different from those invoked in the KPL-IFF model, we performed a systematic analysis of 26,069 network architectures with four reaction arrows between four receptor states and Y, P, and an additional node X. Both activation and inhibition are considered but for clarity only activation arrows are depicted. We found 274 networks compatible with all phenotypic features but all of these networks relied on the KPL-IFF mechanism (SI Appendix, Movie S2). (F and G) Two representative compatible networks show that although the network is more complicated both rely on the KPL-IFF mechanism. (H) As before, negative feedback in the absence of incoherent feed-forward is unable to produce the phenotypic features. See SI Appendix for computational details.
Fig. 5.
Fig. 5.
The KPL-IFF model predicts T-cell activation in response to copresentation of pMHC ligands. (A) Schematic of signal integration by two distinct populations of pMHC ligands in the context of the KPL-IFF model. (B) The model predicts that a titration of a low-affinity ligand (koff1=1 s−1) in the presence of a fixed concentration of a high-affinity ligand (koff2=0.001 s−1) will be either sigmoidal or constant when the concentration of the high-affinity ligand is left of its peak (purple, cyan, and green) or right of its peak (orange, brown, and red), respectively. Appreciable inhibition by the low-affinity ligand is not predicted even when the activating pathway has saturated. (C) T-cell activation as measured by supernatant IL-8 released by Jurkat T cells in response to a titration of 5P (lower-affinity ligand) at the indicated fixed concentrations of 4A (higher-affinity ligand). The fixed concentration of the higher-affinity ligand is indicated and labeled on the x axis as colored circles. Data are representative of two independent experiments. See SI Appendix for computational details.

References

    1. Smith-Garvin JE, Koretzky GA, Jordan MS. T cell activation. Annu Rev Immunol. 2009;27:591–619. - PMC - PubMed
    1. Altan-Bonnet G, Germain RN. Modeling T cell antigen discrimination based on feedback control of digital ERK responses. PLoS Biol. 2005;3(11):e356. - PMC - PubMed
    1. Dushek O, van der Merwe PA. An induced rebinding model of antigen discrimination. Trends Immunol. 2014;35(4):153–158. - PMC - PubMed
    1. Turner MS, Kane LP, Morel PA. Dominant role of antigen dose in CD4+Foxp3+ regulatory T cell induction and expansion. J Immunol. 2009;183(8):4895–4903. - PMC - PubMed
    1. Gottschalk RA, Corse E, Allison JP. TCR ligand density and affinity determine peripheral induction of Foxp3 in vivo. J Exp Med. 2010;207(8):1701–1711. - PMC - PubMed

Publication types

MeSH terms

LinkOut - more resources