. 2016 Oct 5:7:12992.
doi: 10.1038/ncomms12992.

Genomic and oncogenic preference of HBV integration in hepatocellular carcinoma

Affiliations

Genomic and oncogenic preference of HBV integration in hepatocellular carcinoma

Ling-Hao Zhao et al. Nat Commun. .

Erratum in

  • Erratum: Genomic and oncogenic preference of HBV integration in hepatocellular carcinoma.
    Zhao LH, Liu X, Yan HX, Li WY, Zeng X, Yang Y, Zhao J, Liu SP, Zhuang XH, Lin C, Qin CJ, Zhao Y, Pan ZY, Huang G, Liu H, Zhang J, Wang RY, Yang Y, Wen W, Lv GS, Zhang HL, Wu H, Huang S, Wang MD, Tang L, Cao HZ, Wang L, Lee TL, Jiang H, Tan YX, Yuan SX, Hou GJ, Tao QF, Xu QG, Zhang XQ, Wu MC, Xu X, Wang J, Yang HM, Zhou WP, Wang HY. Zhao LH, et al. Nat Commun. 2016 Nov 8;7:13591. doi: 10.1038/ncomms13591. Nat Commun. 2016. PMID: 27824035 Free PMC article. No abstract available.

Abstract

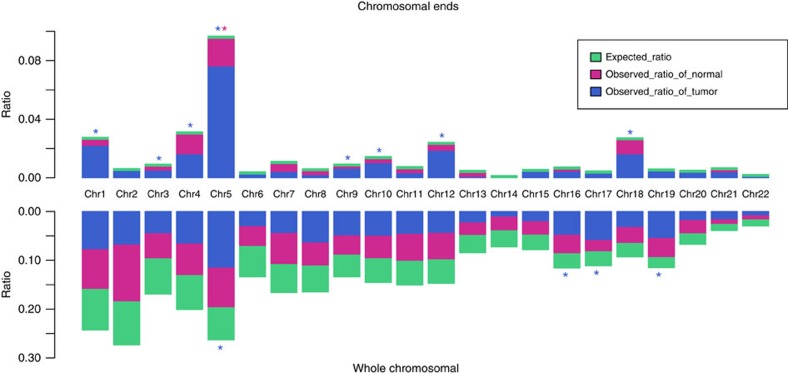
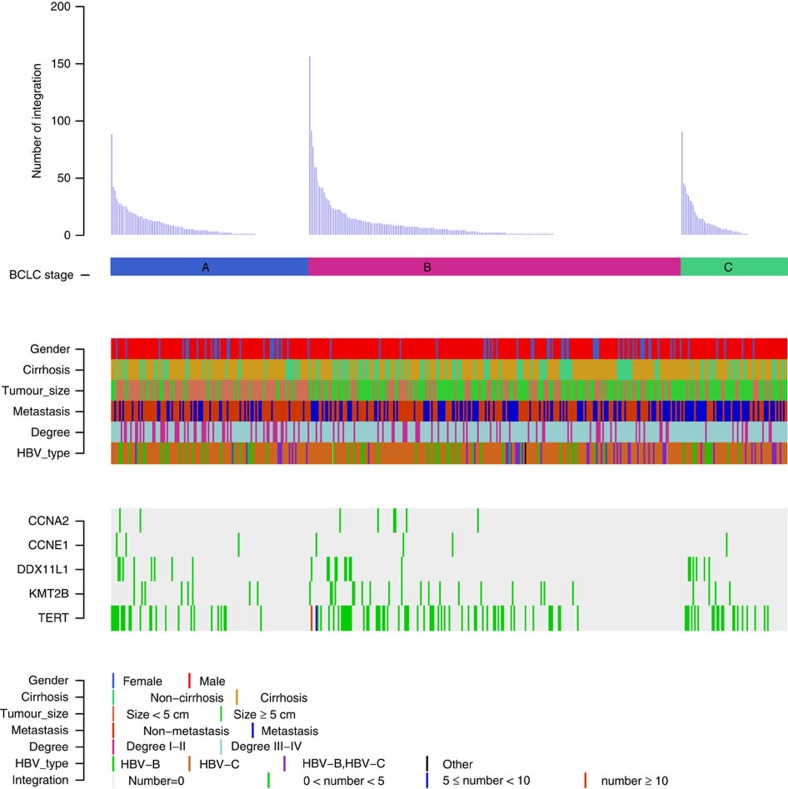
Hepatitis B virus (HBV) can integrate into the human genome, contributing to genomic instability and hepatocarcinogenesis. Here by conducting high-throughput viral integration detection and RNA sequencing, we identify 4,225 HBV integration events in tumour and adjacent non-tumour samples from 426 patients with HCC. We show that HBV is prone to integrate into rare fragile sites and functional genomic regions including CpG islands. We observe a distinct pattern in the preferential sites of HBV integration between tumour and non-tumour tissues. HBV insertional sites are significantly enriched in the proximity of telomeres in tumours. Recurrent HBV target genes are identified with few that overlap. The overall HBV integration frequency is much higher in tumour genomes of males than in females, with a significant enrichment of integration into chromosome 17. Furthermore, a cirrhosis-dependent HBV integration pattern is observed, affecting distinct targeted genes. Our data suggest that HBV integration has a high potential to drive oncogenic transformation.


Figures

Figure 1
Figure 1. Distribution of HBV integration breakpoints throughout the human genomes in 426 paired samples.
(a) Distribution of integration breakpoints across the human genome in 426 paired samples. Each bar represents the sample frequency of HBV integration breakpoints at a particular locus in the human genome (hg19). Tumour (red) and non-tumour (dark blue) samples with HBV integrations are shown on the inner and outer circles, respectively. Histogram axis units represent number of samples. Some loci with a high frequency of integration are marked. GENE. (b) Comparison of the breakpoints in the CpG island region of 426 paired samples. The expected (assuming uniform, random distribution, yellow) and the observed (actual numbers, tumour: blue; normal liver tissue: purple) percentages of HBV integration breakpoints of tumour and non-tumour samples in CpG islands region are shown. P values were calculated by χ2 test. (c) Distribution of integration breakpoints in the fragile region (FR) of 426 paired tumor and non-tumor tissues. The expected (assuming uniform, random distribution, yellow) and the observed (actual numbers, tumour: blue; normal liver tissue: purple) ratios of HBV integration breakpoints in common fragile region, rare fragile region and non-fragile region are shown. P values were calculated by χ2 test. Common: common FR; rare: rare FR; NFRs: non-fragile regions.
Figure 2
Figure 2. Chromosome enrichment and chromosomal ends enrichment of HBV integration in human genome in 426 paired samples.
Each bar of whole-chromosome represents the expected (assuming uniform, random distribution, green) and the observed (actual numbers, tumour: blue, normal liver tissue: purple) ratio of HBV integration breakpoints at a particular chromosome in human genome. Ratios are numbered. Each bar of chromosomal ends represents the expected (assuming uniform, random distribution, green) and the observed (actual numbers, tumor: blue, normal liver tissue, purple) ratio of HBV integration breakpoints at the 2 M region of chromosomal ends in human genome. Ratios are numbered. Dark red star represents statistically significant difference between normal liver samples and random distribution. Blue star represents statistically significant difference between tumour samples and random distribution. P values were calculated by χ2 test.
Figure 3
Figure 3. Clinical correlation analysis of HBV integration in HCC.
(a) Kaplan–Meier survival curves for individuals with (BK>0, n=319) versus without (BK=0, n=97) HBV integration breakpoints by log-rank test. Those who lacked prognostic information were excluded from the analysis (n=10). (b) Gene expression levels of TERT that frequently harboured HBV integrations in samples with versus without HBV integration events. Gene expression was normalized by the corresponding adjacent, normal control and is represented as the tumour/normal gene expression level. P values of unpaired Student's t test are shown. In the box plots, the median (50th percentile) is the middle line, with the bottom and top of the box representing the 25th and 75th percentiles of the data, respectively. The ends of the whiskers represent the lowest and highest data within the 1.5 interquartile range (IQR). IQR was defined as the distance between the lower and upper quartiles of the data. (c) Kaplan–Meier survival curves for individuals with (n=101) versus without (n=315) HBV integration in TERT by log-rank test.
Figure 4
Figure 4. Distribution of integration breakpoints in the HBV genome.
(a) Distribution of integration breakpoints in the HBV genome in 426 paired samples. Each bar represents the number of HBV integration breakpoints (Tumour: blue, Normal liver tissue: red) or sample frequency (tumour: green, normal liver tissue: yellow) at a particular locus in HBV genome. Histograms were constructed for 100-bp intervals. Histogram axis units represent number of breakpoints, and outer DNA numbering is given in bases. HBV genes with different functions are shown. (b) Distribution of integration breakpoints of both DNA and RNA level of 12 paired samples. Histograms were constructed for 100-bp intervals. The number of HBV integration of RNA (red) and DNA (blue) level are shown on the inner and outer circles. Histogram axis units represent number of breakpoints, and outer DNA numbering is given in bases. HBV genes with different functions are shown.
Figure 5
Figure 5. Clinical annotation of HBV integration sites in 426 HCC samples.
All panels are aligned with vertical tracks representing 426 individuals. The data are sorted by BCLC stage, gender, cirrhosis, tumour size, metastasis, Edmonson-Steiner classification and HBV type. The bottom heat map shows the distribution of HBV integrations into the five recurrent HBV targeted genes in HCC samples.
Figure 6
Figure 6. HBV integration preference in male versus female HCC samples.
(a) Distribution of the enriched HBV integration regions in tumour samples. The red bars indicate the enriched regions found only in female samples, green bars represent enriched regions only found in male samples, and blue bars mean enriched regions found in both. In every 1M window of chromosomal region, the observed number of integration sites was tested against the expected number where all integrations distributed randomly across the genome. Enrichment was defined as P value smaller than 0.05 calculated by χ2 test, which was performed separately in male and female samples. (b) Comparison of the numbers of breakpoints in tumour tissues of male and female samples. The HBV breakpoints number of male (left) and female (right) are shown. The box plots show the median (horizontal bar), 25th and 75th percentiles, and the whiskers of the plots show the smallest and largest values. P values was calculated by unpaired Student's t test. (c) Comparison of integration ratio of male and female HCC samples. The HBV integration ratio of male (left) and female (right) HCC samples are shown. P values were calculated by χ2 test.

References

    1. Forner A., Llovet J. M. & Bruix J. Hepatocellular carcinoma. Lancet 379, 1245–1255 (2012). - PubMed
    1. Siegel R., Naishadham D. & Jemal A. Cancer statistics, 2013. CA Cancer J. Clin. 63, 11–30 (2013). - PubMed
    1. Chen J. G. & Zhang S. W. Liver cancer epidemic in China: past, present and future. Semin. Cancer Biol. 21, 59–69 (2011). - PubMed
    1. Shafritz D. A. et al.. Integration of hepatitis B virus DNA into the genome of liver cells in chronic liver disease and hepatocellular carcinoma. Studies in percutaneous liver biopsies and post-mortem tissue specimens. N. Engl. J. Med. 305, 1067–1073 (1981). - PubMed
    1. Hanahan D. & Weinberg R. A. Hallmarks of cancer: the next generation. Cell 144, 646–674 (2011). - PubMed

Publication types

MeSH terms