

Measuring populations to improve vaccination coverage
- PMID: 27703191
- PMCID: PMC5050518
- DOI: 10.1038/srep34541
Measuring populations to improve vaccination coverage
Abstract
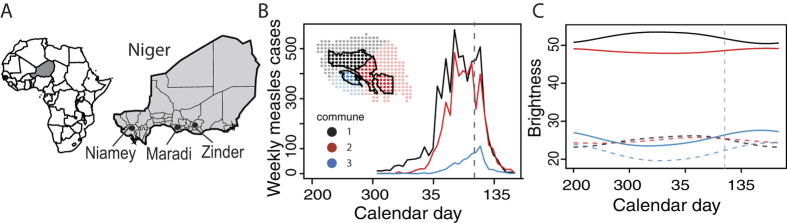
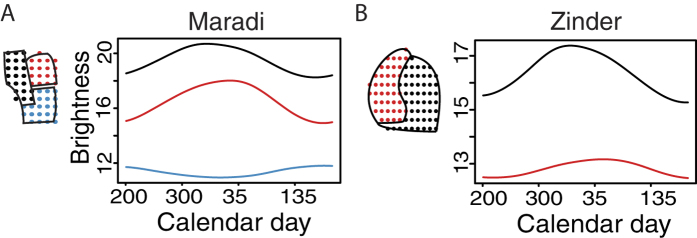
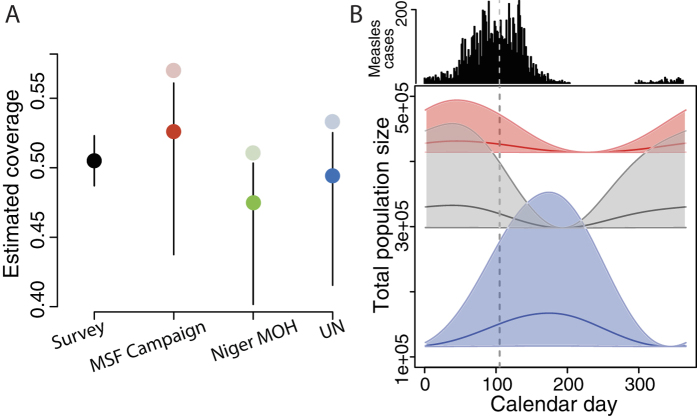
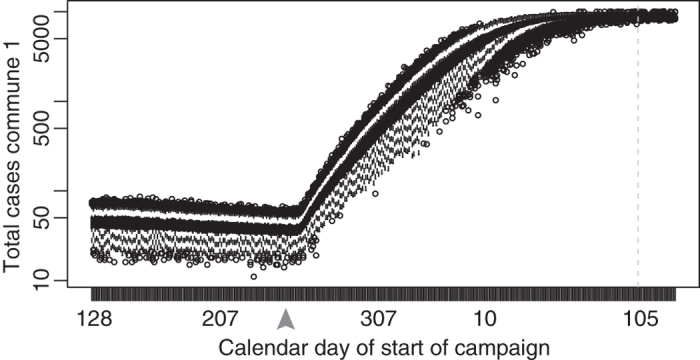
In low-income settings, vaccination campaigns supplement routine immunization but often fail to achieve coverage goals due to uncertainty about target population size and distribution. Accurate, updated estimates of target populations are rare but critical; short-term fluctuations can greatly impact population size and susceptibility. We use satellite imagery to quantify population fluctuations and the coverage achieved by a measles outbreak response vaccination campaign in urban Niger and compare campaign estimates to measurements from a post-campaign survey. Vaccine coverage was overestimated because the campaign underestimated resident numbers and seasonal migration further increased the target population. We combine satellite-derived measurements of fluctuations in population distribution with high-resolution measles case reports to develop a dynamic model that illustrates the potential improvement in vaccination campaign coverage if planners account for predictable population fluctuations. Satellite imagery can improve retrospective estimates of vaccination campaign impact and future campaign planning by synchronizing interventions with predictable population fluxes.
Figures
Similar articles
-
Measles vaccination coverage in high-incidence areas of the Western Cape, following the mass vaccination campaign.S Afr Med J. 2013 Jan 24;103(3):181-6. doi: 10.7196/samj.6196. S Afr Med J. 2013. PMID: 23472696
-
Exploring the time to intervene with a reactive mass vaccination campaign in measles epidemics.Epidemiol Infect. 2006 Aug;134(4):845-9. doi: 10.1017/S0950268805005716. Epub 2006 Jan 26. Epidemiol Infect. 2006. PMID: 16438743 Free PMC article.
-
Failure of targeted urban supplemental measles vaccination campaigns (1997-1999) to prevent measles epidemics in Mozambique (1998-2001).J Infect Dis. 2003 May 15;187 Suppl 1:S51-7. doi: 10.1086/368058. J Infect Dis. 2003. PMID: 12721891
-
[Measles control in developing countries].Sante. 1994 May-Jun;4(3):163-71. Sante. 1994. PMID: 7921681 Review. French.
-
Mass vaccination: when and why.Curr Top Microbiol Immunol. 2006;304:1-16. doi: 10.1007/3-540-36583-4_1. Curr Top Microbiol Immunol. 2006. PMID: 16989261 Review.
Cited by
-
Containing measles in conflict-driven humanitarian settings.BMJ Glob Health. 2020 Sep;5(9):e003515. doi: 10.1136/bmjgh-2020-003515. BMJ Glob Health. 2020. PMID: 32967982 Free PMC article. No abstract available.
-
One step ahead: timing and sexual networks in population mobility and HIV prevention and care.J Int AIDS Soc. 2018 Jul;21 Suppl 4(Suppl Suppl 4):e25140. doi: 10.1002/jia2.25140. J Int AIDS Soc. 2018. PMID: 30027553 Free PMC article. No abstract available.
-
Using big data for evaluating development outcomes: A systematic map.Campbell Syst Rev. 2021 Jul 3;17(3):e1149. doi: 10.1002/cl2.1149. eCollection 2021 Sep. Campbell Syst Rev. 2021. PMID: 37051451 Free PMC article.
-
High resolution age-structured mapping of childhood vaccination coverage in low and middle income countries.Vaccine. 2018 Mar 14;36(12):1583-1591. doi: 10.1016/j.vaccine.2018.02.020. Epub 2018 Feb 14. Vaccine. 2018. PMID: 29454519 Free PMC article.
-
Estimating population-based coverage of reproductive, maternal, newborn, and child health (RMNCH) interventions from health management information systems: a comprehensive review.BMC Health Serv Res. 2021 Oct 25;21(Suppl 2):1083. doi: 10.1186/s12913-021-06995-z. BMC Health Serv Res. 2021. PMID: 34689787 Free PMC article. Review.
References
-
- Perry R. T. et al.. Progress toward regional measles elmination - Worldwide, 2000–2014. Morbidity and Mortality Weekly Report 64, 1246–1251 (2015). - PubMed
-
- World Health Organization. Immunization coverage. Fact Sheets. http://www.who.int/mediacentre/factsheets/fs378/en/ May 20 2014 (2014).
-
- CDC. Measles–United States, January–May 2011. Morbidity and Mortality Weekly Report 60, 666–668 (2011). - PubMed
Publication types
MeSH terms
Grants and funding
LinkOut - more resources
Full Text Sources
Other Literature Sources
Medical
