

The natural selection of bad science
- PMID: 27703703
- PMCID: PMC5043322
- DOI: 10.1098/rsos.160384
The natural selection of bad science
Erratum in
-
Correction to: 'The natural selection of bad science' (2016) by Paul E. Smaldino and Richard McElreath.R Soc Open Sci. 2023 Sep 6;10(9):rsos231026. doi: 10.1098/rsos.231026. eCollection 2023 Sep. R Soc Open Sci. 2023. PMID: 37680497 Free PMC article.
Abstract
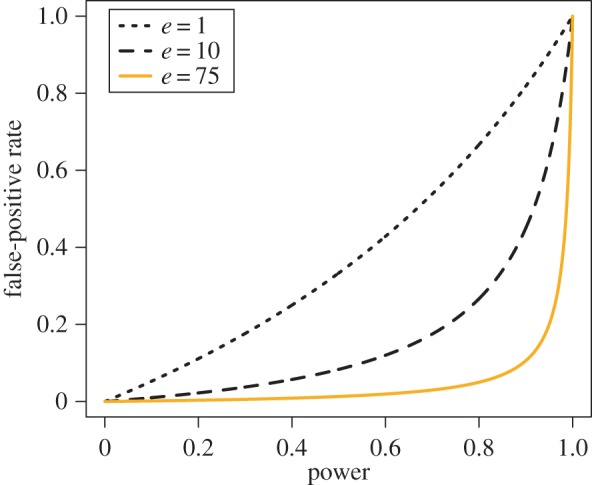
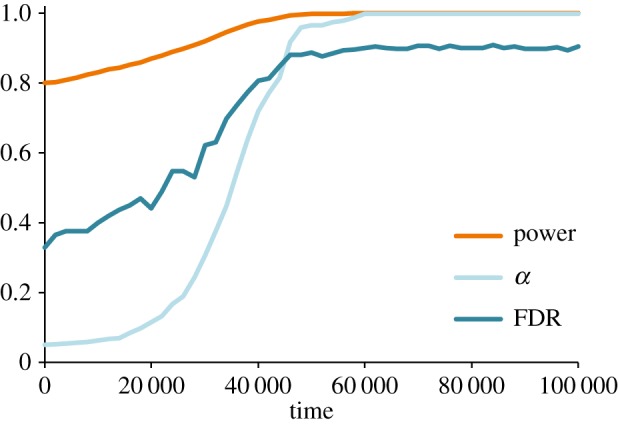
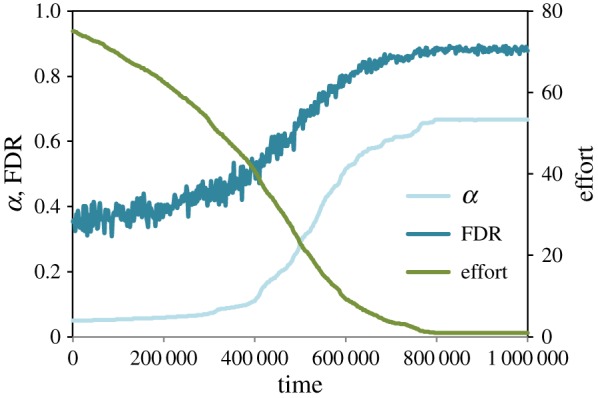
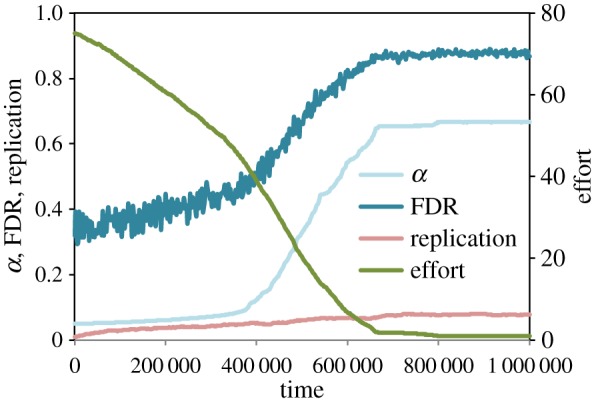
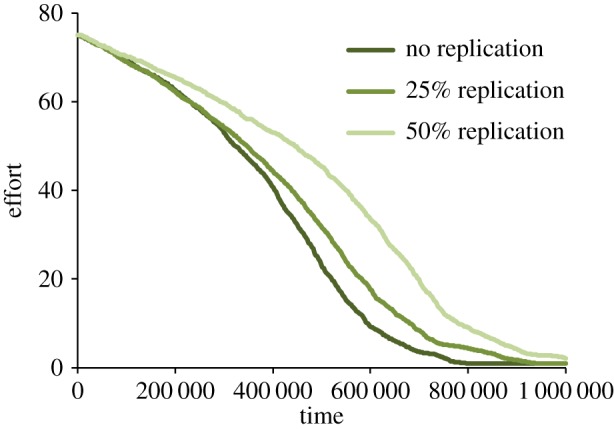
Poor research design and data analysis encourage false-positive findings. Such poor methods persist despite perennial calls for improvement, suggesting that they result from something more than just misunderstanding. The persistence of poor methods results partly from incentives that favour them, leading to the natural selection of bad science. This dynamic requires no conscious strategizing-no deliberate cheating nor loafing-by scientists, only that publication is a principal factor for career advancement. Some normative methods of analysis have almost certainly been selected to further publication instead of discovery. In order to improve the culture of science, a shift must be made away from correcting misunderstandings and towards rewarding understanding. We support this argument with empirical evidence and computational modelling. We first present a 60-year meta-analysis of statistical power in the behavioural sciences and show that power has not improved despite repeated demonstrations of the necessity of increasing power. To demonstrate the logical consequences of structural incentives, we then present a dynamic model of scientific communities in which competing laboratories investigate novel or previously published hypotheses using culturally transmitted research methods. As in the real world, successful labs produce more 'progeny,' such that their methods are more often copied and their students are more likely to start labs of their own. Selection for high output leads to poorer methods and increasingly high false discovery rates. We additionally show that replication slows but does not stop the process of methodological deterioration. Improving the quality of research requires change at the institutional level.
Keywords: Campbell’s Law; cultural evolution; incentives; metascience; replication; statistical power.
Figures


Comment in
-
Authorship position should not serve as a proxy metric.Nature. 2018 Feb 22;554(7693):423. doi: 10.1038/d41586-018-02204-w. Nature. 2018. PMID: 29469129 No abstract available.
-
Better methods can't make up for mediocre theory.Nature. 2019 Nov;575(7781):9. doi: 10.1038/d41586-019-03350-5. Nature. 2019. PMID: 31695216 No abstract available.
References
-
- Campbell DT. 1976. Assessing the impact of planned social change. Hanover, NH: The Public Affairs Center.
-
- Wasserstein RL, Lazar NA. 2016. The ASA’s statement on p-values: context, process, and purpose. Am. Stat. 70, 129–133. (doi:10.1080/00031305.2016.1154108) - DOI
-
- Meehl PE. 1967. Theory-testing in psychology and physics: a methodological paradox. Phil. Sci. 34, 103–115. (doi:10.1086/288135) - DOI
-
- Cohen J. 1994. The earth is round (p<.05). Am. Psychol. 49, 997–1003. (doi:10.1037/0003-066X.49.12.997) - DOI
-
- Enserink M. 2012. Final report on Stapel blames field as a whole. Science 338, 1270–1271. (doi:10.1126/science.338.6112.1270) - DOI - PubMed
LinkOut - more resources
Full Text Sources
Other Literature Sources
Research Materials