. 2016 Oct 4;111(7):1396-1408.
doi: 10.1016/j.bpj.2016.08.035.

A Novel Voltage Sensor in the Orthosteric Binding Site of the M2 Muscarinic Receptor

Affiliations

A Novel Voltage Sensor in the Orthosteric Binding Site of the M2 Muscarinic Receptor

Ofra Barchad-Avitzur et al. Biophys J. .

Abstract

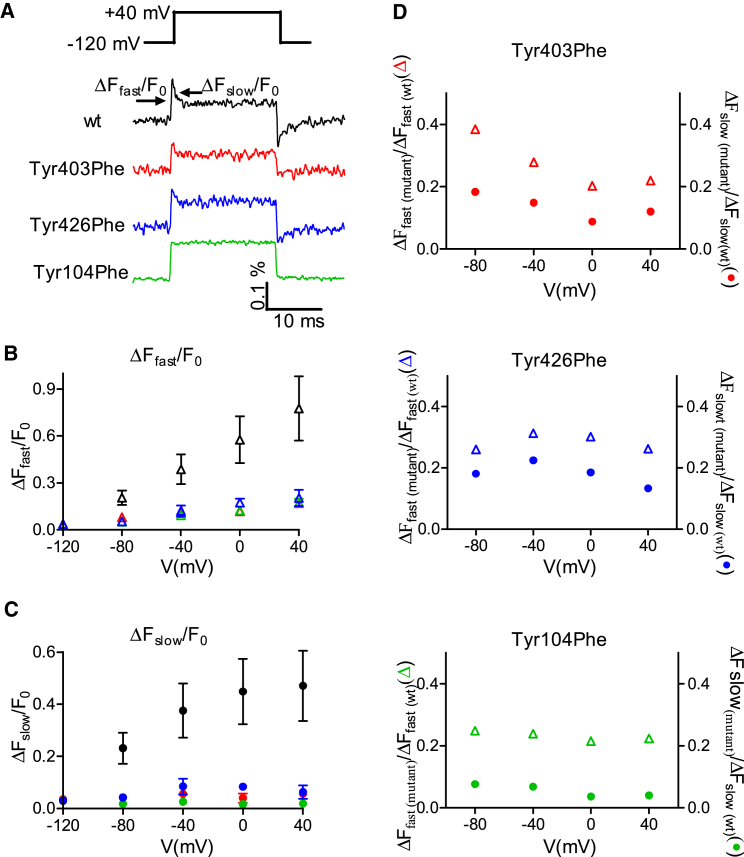
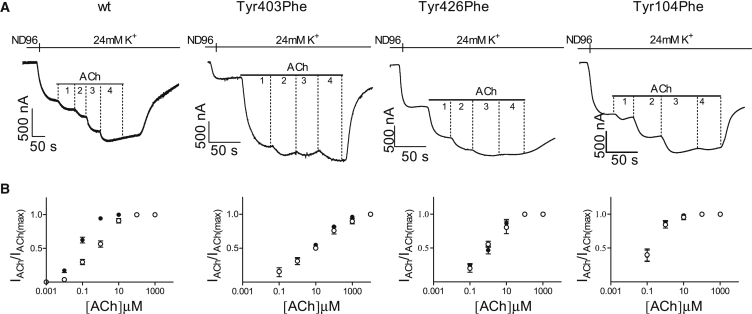
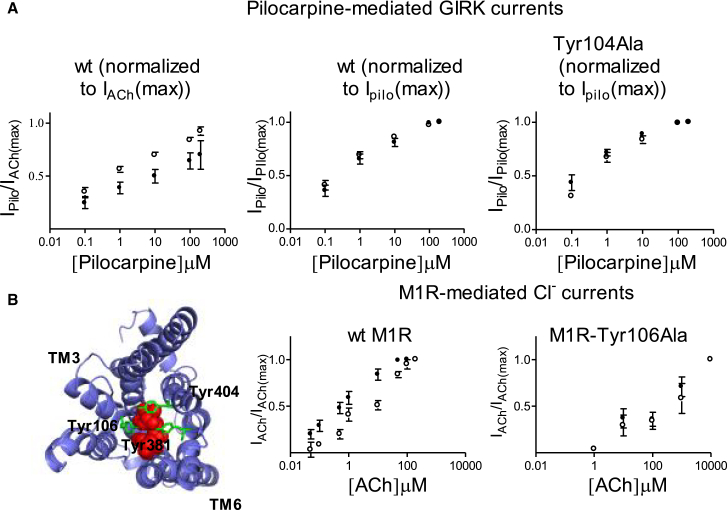
G protein-coupled receptors (GPCRs) mediate many signal transduction processes in the body. The discovery that these receptors are voltage-sensitive has changed our understanding of their behavior. The M2 muscarinic acetylcholine receptor (M2R) was found to exhibit depolarization-induced charge movement-associated currents, implying that this prototypical GPCR possesses a voltage sensor. However, the typical domain that serves as a voltage sensor in voltage-gated channels is not present in GPCRs, making the search for the voltage sensor in the latter challenging. Here, we examine the M2R and describe a voltage sensor that is comprised of tyrosine residues. This voltage sensor is crucial for the voltage dependence of agonist binding to the receptor. The tyrosine-based voltage sensor discovered here constitutes a noncanonical by which membrane proteins may sense voltage.


Figures

Figure 1
Figure 1
Gating currents and fluorescence signals recorded from wt M2R. (A) Top view of the M2R, based on (19). Indicated are the orthosteric binding site (red spheres), Cys416 (purple spheres), and the three tyrosines, Tyr104, Tyr403, and Tyr426 (green). (B) Representative recordings of gating currents evoked by depolarizing pulses (see pulse protocol). Similar recordings were obtained from 6–13 oocytes. Here and in Figs. 2, 3, 4, and 5, the currents were normalized to their peak amplitude and were truncated to 50% of their actual peak. (C) The dependence of Q/R on membrane potential (V). Here and in Figs. 2, 4, and 5, Q/R is expressed in electron charge (e) units per receptor molecule. Each point represents the mean ± SE, n = 7–9. (D) A representative fluorescence signal elicited by a depolarizing pulse; the pulse protocol is shown above (taken from (6)). The fluorescence signal is comprised of a very fast rise in fluorescence intensity (ΔFfast/F0) followed by a slow decay (ΔFslow/F0). (E) The dependence of ΔFfast/F0 on V. Each point represents the mean ± SE, n = 4–5.
Figure 2
Figure 2
Effect of various mutants on gating currents and fluorescence signals. (A) The dependence of Q/R on membrane potential (V). Each point represents the mean ± SE, n = 7–9. The average (± SE) expression level of wt and of each mutant is shown in the insets. (B) Representative recordings of gating currents evoked by depolarizing pulses. Similar recordings were obtained from 6–13 oocytes. (C) The dependence of ΔFfast/F0 on V. Each point represents the mean ± SE, n = 4–5.
Figure 3
Figure 3
Representative gating currents recorded from wt, Tyr403Ala, and Tyr426Ala induced by depolarizing pulses to the indicated potentials from a holding potential of −120 mV. The arrows indicate the bump. Similar recordings were obtained from 10–13 oocytes.
Figure 4
Figure 4
Effect of the triple mutant on the gating currents. (A) The dependence of Q/R on membrane potential. Each point represents the mean ± SE, n =5. The average (± SE) expression level of wt and the mutant is shown in the insets. (B) Representative recordings of gating currents evoked by depolarizing steps. Similar recordings were obtained from 5 oocytes.
Figure 5
Figure 5
Effect of Tyr403Phe, Tyr426Phe, and Tyr104Phe on the gating currents. (A) The dependence of Q/R on membrane potential. Each point represents mean ± SE, n =7–11. The average (± SE) expression level of wt and of each mutant is shown in the insets. (B) Representative recordings of gating currents evoked by depolarizing steps. Similar recordings were obtained from 10–12 oocytes.
Figure 6
Figure 6
Effect of the phenylalanine mutations on the fluorescence signal. (A) Representative fluorescence traces elicited by depolarizing pulses to +40 mV from the various mutants. Similar recordings were obtained from 2–6 oocytes. For all panels, wt is black, Tyr403Phe is red, Tyr426Phe is blue, and Tyr104Phe is green. (B) Dependence of ΔFfast/F0 on V. (C) Dependence of ΔFslow/F0 on V. (D) Comparison between ΔFslow/F0(mutant)/ΔFslow/F0(wt) (solid circles) and ΔFfast/F0(mutant)/ΔFfast/F0(wt) (open triangles). Each point in (B) and (C) represents the mean ± SE, n = 3–7.
Figure 7
Figure 7
Voltage dependence of agonist binding. (A) Representative recordings of ACh-mediated GIRK currents (IACh) obtained at −80 mV from wt (left column), Tyr403Phe (second column), Tyr426Phe (third column), and Tyr104Phe (right column). The numbers 1–4 represent different ACh concentrations as follows: for wt, 0.01, 0.1, 1, and 100 μM; for Tyr403Phe, 10, 100, 1000, and 10,000 μM; for Tyr426Phe and Tyr104Phe, 1, 10, 100, and 1000 μM. (B) Dose-response curves obtained from several experiments at −80 mV (solid circles) and at +40 mV (open circles) using various concentrations of ACh from wt and various mutants, as indicated. Each point represents the mean ± SE, n = 5–8.
Figure 8
Figure 8
(A) Voltage dependence of pilocarpine-evoked GIRK currents (Ipilo). Dose-response, obtained at −80 mV (solid circles) and at +40 mV (open circles), from wt (left and middle) and Tyr104Phe (right). The curves in the left plot are normalized to the maximal IACh at each holding potential, whereas the curves in the middle and right plots are normalized to the maximal Ipilo at each holding potential. Each point represents the mean ± SE, n = 6–14. (B) Voltage dependence of M1R- activated Ca2+-dependent Cl currents. Left: Top view of the M1R, based on (25). Indicated are the orthosteric binding site (red spheres) and the three tyrosines, Tyr106, Tyr381, and Tyr404 (green). Dose-response, obtained at −80 mV (solid circles) and at +40 mV (open circles), from wt M1R (middle, taken from (4)) and M1R-Tyr106Ala (right). The curves are normalized to the maximal IACh at each holding potential. Each point represents the mean ± SE, n = 3–13.

References

    1. Rinne A., Mobarec J.C., Bünemann M. The mode of agonist binding to a G protein-coupled receptor switches the effect that voltage changes have on signaling. Sci. Signal. 2015;8:ra110. - PubMed
    1. Ben Chaim Y., Bochnik S., Parnas H. Voltage affects the dissociation rate constant of the m2 muscarinic receptor. PLoS One. 2013;8:e74354. - PMC - PubMed
    1. Ben-Chaim Y., Chanda B., Parnas H. Movement of “gating charge” is coupled to ligand binding in a G-protein-coupled receptor. Nature. 2006;444:106–109. - PubMed
    1. Ben-Chaim Y., Tour O., Parnas H. The M2 muscarinic G-protein-coupled receptor is voltage-sensitive. J. Biol. Chem. 2003;278:22482–22491. - PubMed
    1. Bolton T.B., Zholos A.V. Potential synergy: voltage-driven steps in receptor-G protein coupling and beyond. Sci. STKE. 2003;2003:pe52. - PubMed

MeSH terms

LinkOut - more resources