. 2016 Oct 4;111(7):1541-1552.
doi: 10.1016/j.bpj.2016.08.011.

A Chemomechanical Model for Nuclear Morphology and Stresses during Cell Transendothelial Migration

Affiliations

A Chemomechanical Model for Nuclear Morphology and Stresses during Cell Transendothelial Migration

Xuan Cao et al. Biophys J. .

Abstract

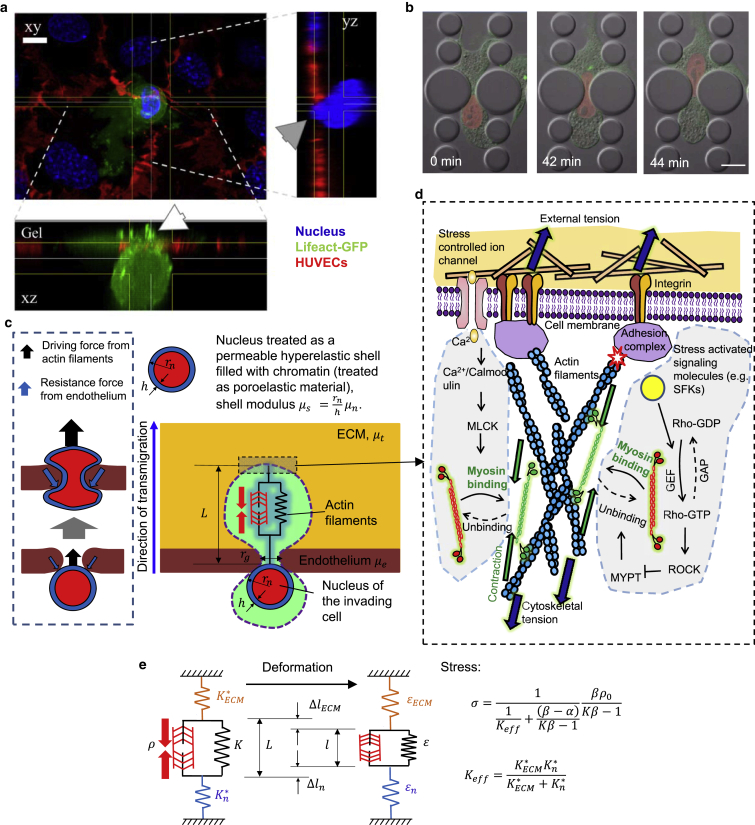
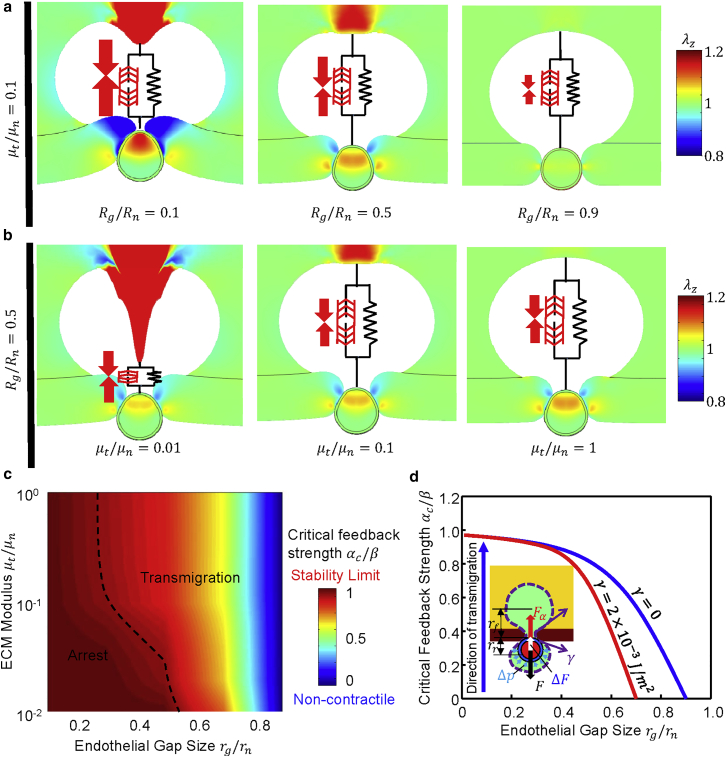
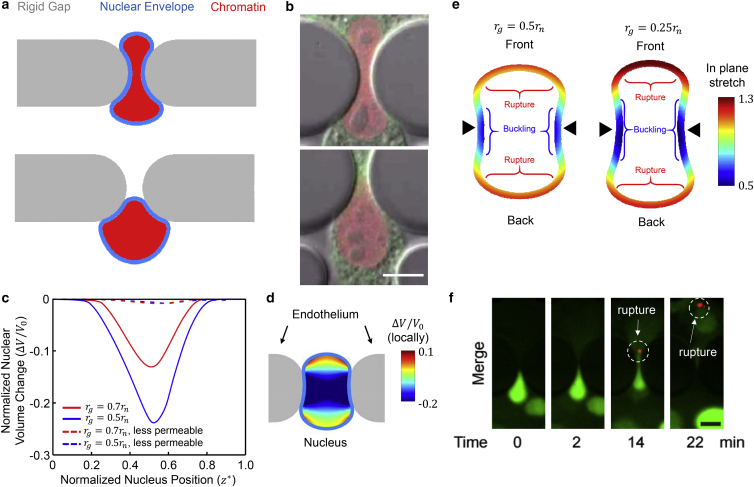
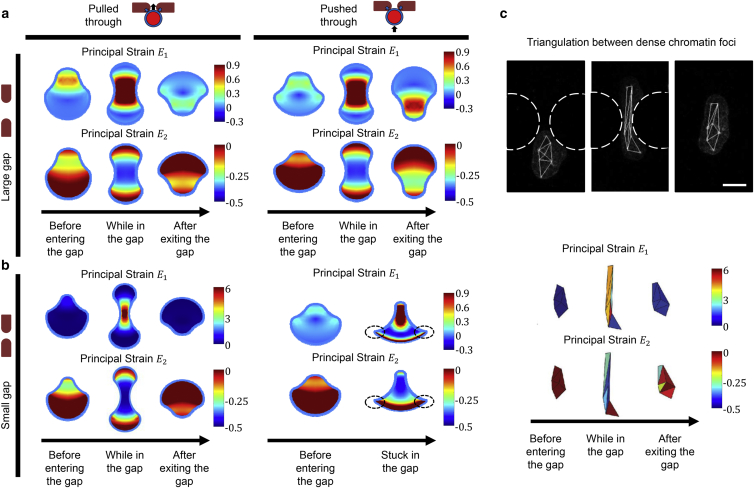
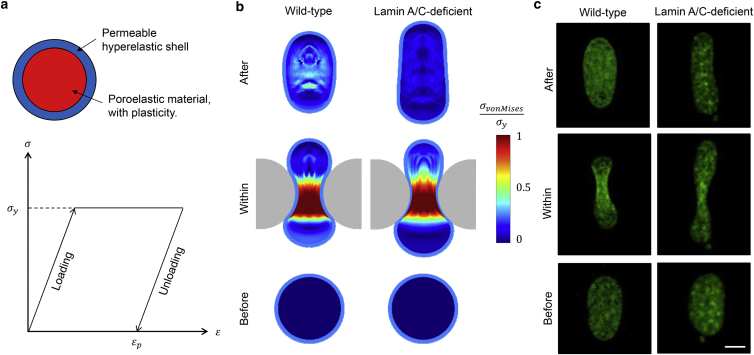
It is now evident that the cell nucleus undergoes dramatic shape changes during important cellular processes such as cell transmigration through extracellular matrix and endothelium. Recent experimental data suggest that during cell transmigration the deformability of the nucleus could be a limiting factor, and the morphological and structural alterations that the nucleus encounters can perturb genomic organization that in turn influences cellular behavior. Despite its importance, a biophysical model that connects the experimentally observed nuclear morphological changes to the underlying biophysical factors during transmigration through small constrictions is still lacking. Here, we developed a universal chemomechanical model that describes nuclear strains and shapes and predicts thresholds for the rupture of the nuclear envelope and for nuclear plastic deformation during transmigration through small constrictions. The model includes actin contraction and cytosolic back pressure that squeeze the nucleus through constrictions and overcome the mechanical resistance from deformation of the nucleus and the constrictions. The nucleus is treated as an elastic shell encompassing a poroelastic material representing the nuclear envelope and inner nucleoplasm, respectively. Tuning the chemomechanical parameters of different components such as cell contractility and nuclear and matrix stiffnesses, our model predicts the lower bounds of constriction size for successful transmigration. Furthermore, treating the chromatin as a plastic material, our model faithfully reproduced the experimentally observed irreversible nuclear deformations after transmigration in lamin-A/C-deficient cells, whereas the wild-type cells show much less plastic deformation. Along with making testable predictions, which are in accord with our experiments and existing literature, our work provides a realistic framework to assess the biophysical modulators of nuclear deformation during cell transmigration.


Figures

Figure 1
Figure 1
Computational model for tumor cell transmigration. (a) High-resolution confocal z-stack of a cancer cell (Lifeact-GFP, MDA-MB-231, green) transmigrating through an endothelial monolayer (PECAM-1, HUVECs, red) cultured on a collagen gel. The nuclei were stained with Hoechst (blue). The white arrow indicates actin-rich protrusions at the leading edge of the cancer cell entering the ECM. The gray arrow indicates the front of the cancer cell nucleus squeezing through the endothelial gap. Scale bar, 10 μm. (b) Representative time-lapse images of a fibroblast (NIH 3T3) expressing mCherry-Histone4 (red) and GFP-actin (green) migrating through a 3-μm-wide rigid constriction in a 5-μm-tall microfluidic device. Scale bar, 15 μm. (c) The nucleus is modeled as a permeable hyperelastic shell (representing the NE) with modulus μs filled with chromatin (modeled as a poroelastic material with modulus μc and Poisson’s ratio in the range ∼0.3–0.5 based on permeability). The parameters in the model are the shear moduli for the endothelium (μe), the ECM (μt), and the nucleus (μn), the nuclear radius (rn), the endothelial gap size (rg), and the average length of the actin filaments (L). The nuclear stiffness, μn, is mainly determined by the NE elasticity, μs=(rn/h)μn, μc=0.1μn, where h is the thickness of the shell. (d) The driving force for transmigration is generated by stress-dependent contraction of the actomyosin complex. The actomyosin activity is mediated by a variety of biochemical processes, such as the ρ-ROCK and calcium-mediated pathways (see the Supporting Material for details). (e) Schematic for the mechanical model of active contractile stress generation. The actomyosin contraction is modeled by a spring in parallel with an active contractile element, which ensures that stiffer ECMs will generate larger contractile stresses (see the Supporting Material for details). To see this figure in color, go online.
Figure 2
Figure 2
Influence of the endothelial gap size (rg) and ECM modulus (μt) on transmigration. (a) As the gap size decreases (from right to left) the cell cannot transmigrate through the smaller gaps because of the increase in critical resistance force. (b) As the ECM stiffness decreases (from right to left) cells cannot transmigrate since they cannot build up sufficient contractile forces in soft ECMs. Colors in (a) and (b) indicate the stretches along the direction of invasion. (c) Critical feedback strength as a function of the ECM modulus and the endothelial gap size predicted by the model. The dashed line denotes the phase boundary for transmigration. On the righthand side of the phase boundary, αc/β<0.87 and the cells can pass through the gap. The model predicts the physical limit of rg0.3rn for successful transmigration, corresponding to ∼10% of the undeformed nuclear cross section, in excellent agreement with previous measurements (9), as shown in Fig. S3. (d) Cytosolic pressure generated through cortical actomyosin contractility can promote transmigration. Comparison between the critical feedback strength required for transmigration as a function of the endothelial gap size with (red) and without (blue) accounting for pressure exerted on the nucleus due to membrane tension. Model parameters are K=1 kPa, ρ0=0.5 kPa, β=2.77×10³ Pa, μn=5 kPa, μe=1 kPa, μt=0.5 kPa in (a), and rg=0.5rn in (b). To see this figure in color, go online.
Figure 3
Figure 3
Nuclear shapes, spatial distribution of volumetric strains and fluid content as well as nuclear envelope deformation and rupture. (a) Snapshots of the nuclear shapes at different stages of transmigration through a small rigid gap (rg=0.25rn). (b) Nuclear shapes in experiments on cell migration through constrictions in a microfluidic device. The nucleus is labeled by mCherry-Histone4 (red) and the cytoplasm by GFP-actin (green). Scale bar, 10 μm. (c) The normalized nuclear volume change (ΔV/V0) as a function of nuclear position. The nucleus experiences large volumetric strains due to fluid expulsion when it passes through smaller gaps. The model predicts up to ∼24% decrease in nuclear volume during transmigration for the smallest gap (rg=0.5rn). Also the effect of nuclear permeability on volume change is shown. (d) The local volume change (dilatation) exhibits large spatial variations within the nucleus. Contours show the normalized local volumetric strain for a permeable nucleus passing through a gap size of rg=0.7rn (red line in (c)), with blue representing regions with large volume decrease. (e) In-plane stretch just before the nucleus exits the endothelial gap for rg=0.5rn (left) and rg=0.25rn (right) (only the NE is shown). The in-plane stretch of the NE is inhomogeneous, with the front and back of the lamina being under tension (potential location of lamina rupture and bleb formation) while the side of the nucleus in contact with the gap is under compression (potential locations for lamina buckling). Black triangles indicate the gap center. (f) Representative time-lapse images showing NE rupture at the front of an HT1080 cell passing through a constriction. The NE rupture was visualized by the spill of NLS-GFP (green) into the cytoplasm and the accumulation of the cytoplasmic DNA-binding protein cGAS-RFP (red) at the site of rupture at the NE. Scale bar, 10 μm. Model parameters for (a), (c), (d), and (e) are K=1 kPa, ρ0=0.5 kPa, β=2.77×10³ Pa, μn=5 kPa, μt=5 kPa, and μe=10 kPa. To see this figure in color, go online.
Figure 4
Figure 4
Nuclear strains during transmigration. (a and b) Graphical representation of spatial distributions of strains in the nucleus at different stages of transmigration through large (a) (rg = 0.5 rn) and small (b) (rg = 0.25 rn) rigid constrictions under either pushing (left) or pulling (right) forces. (c) The experimental strain maps of lamin A/C-deficient cells (bottom) based on triangulation between present dense chromatin foci (top), adapted from (25) with permission from the Royal Society of Chemistry. Scale bar, 10 μm. Model parameters are K=1 kPa, ρ0 = 0.5 kPa, β = 2.77 × 10⁻³ Pa, μn = 5 kPa, μt = 5 kPa. To see this figure in color, go online.
Figure 5
Figure 5
Impact of chromatin plasticity and lamina stiffness on nuclear shapes after transmigration. (a and b) The nucleus changes its shape from a spheroid to a prolate ellipsoid during transmigration when plastic nuclear matter is considered. (a) Chromatin is assumed to be ideally plastic, with no strain hardening after yielding. The stress-strain response of the chromatin is shown at the bottom. (b) Normalized von Mises stresses (measured relative to the yield stress (σy)) of the nuclear matter during transmigration through a rigid constriction for wild-type (left) and lamin-A/C-deficient (right) cells. Due to the presence of stresses that exceed the yield stress, the nucleus undergoes plastic deformation leading to permanent change in shape after exiting the constriction. Lamin-A/C-deficient cells undergo larger irreversible shape change than wild-type cells. Model parameters are μn=5 kPa and rg=0.4rn. (c) Representative nuclear shapes during different stages of transmigration for wild-type (left) and lamin-A/C-deficient (right) cells, indicating larger irreversible nuclear shape change for lamin-A/C-deficient cells compared to wild-type controls, consistent with the simulations. The nucleus is labeled by H2B-mNeon (green). Scale bar, 10 μm. To see this figure in color, go online.

References

    1. Reymond N., d’Água B.B., Ridley A.J. Crossing the endothelial barrier during metastasis. Nat. Rev. Cancer. 2013;13:858–870. - PubMed
    1. Madsen C.D., Sahai E. Cancer dissemination—lessons from leukocytes. Dev. Cell. 2010;19:13–26. - PubMed
    1. Chen M.B., Whisler J.A., Kamm R.D. Mechanisms of tumor cell extravasation in an in vitro microvascular network platform. Integr. Biol. (Camb) 2013;5:1262–1271. - PMC - PubMed
    1. Chen M.B., Lamar J.M., Kamm R.D. Elucidation of the roles of tumor integrin β1 in the extravasation stage of the metastasis cascade. Cancer Res. 2016;76:2513–2524. - PMC - PubMed
    1. Friedl P., Wolf K., Lammerding J. Nuclear mechanics during cell migration. Curr. Opin. Cell Biol. 2011;23:55–64. - PMC - PubMed

MeSH terms

LinkOut - more resources