. 2016 Oct 4;17(2):527-540.
doi: 10.1016/j.celrep.2016.09.005.

Nat1 Deficiency Is Associated with Mitochondrial Dysfunction and Exercise Intolerance in Mice

Affiliations

Nat1 Deficiency Is Associated with Mitochondrial Dysfunction and Exercise Intolerance in Mice

Indumathi Chennamsetty et al. Cell Rep. .

Abstract

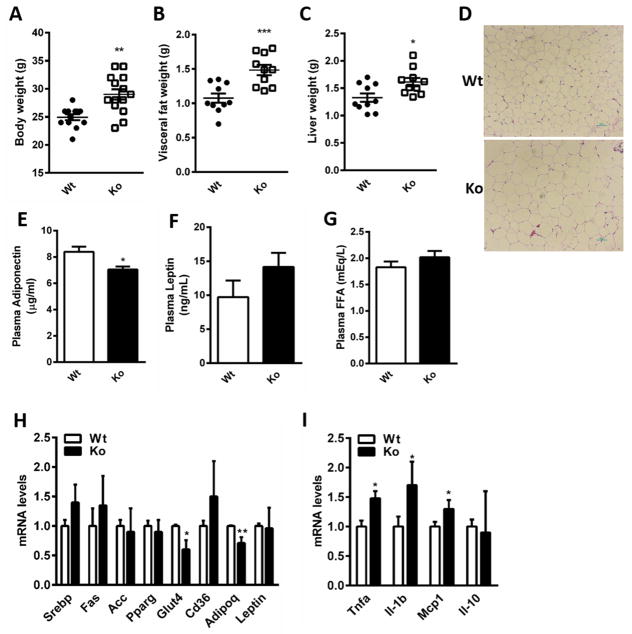
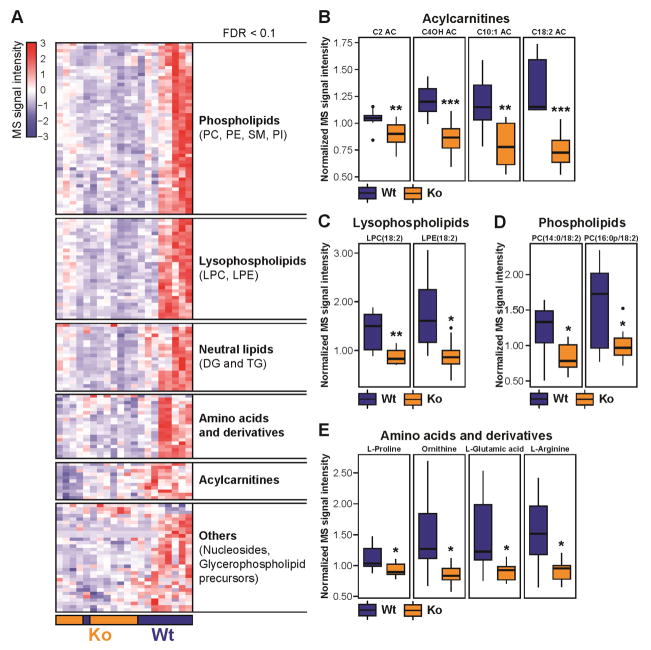
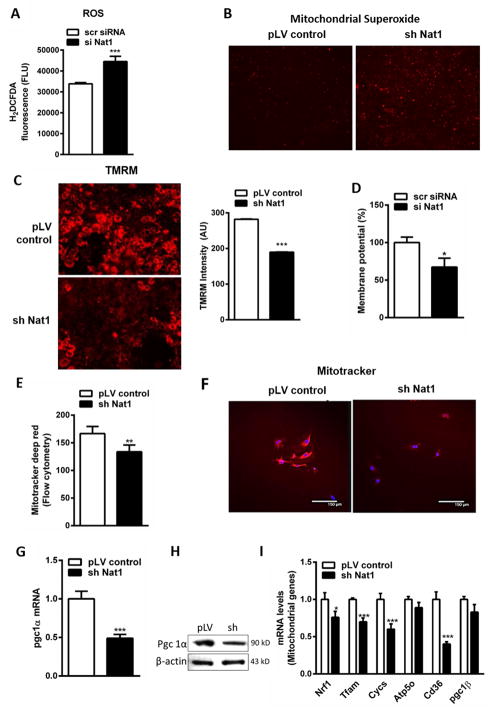
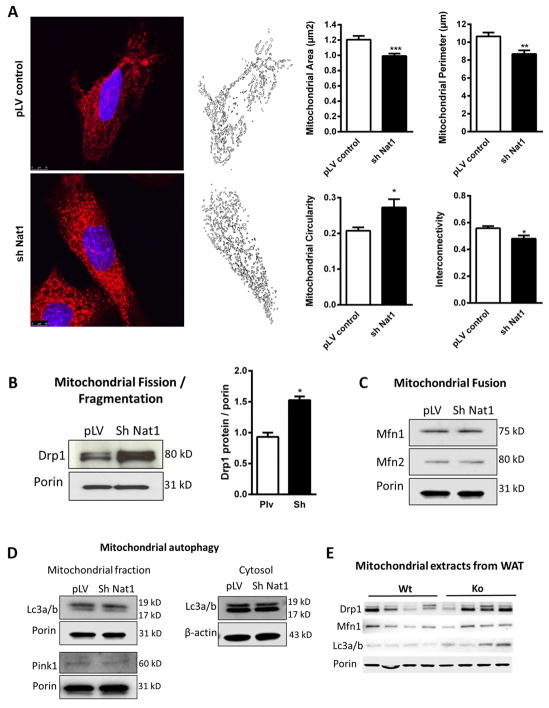
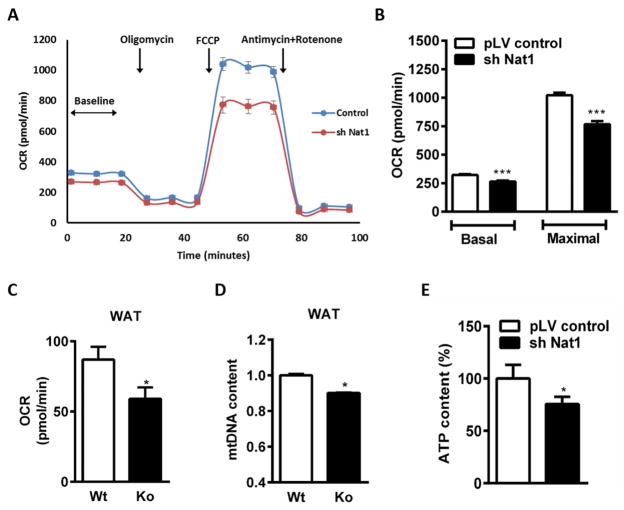
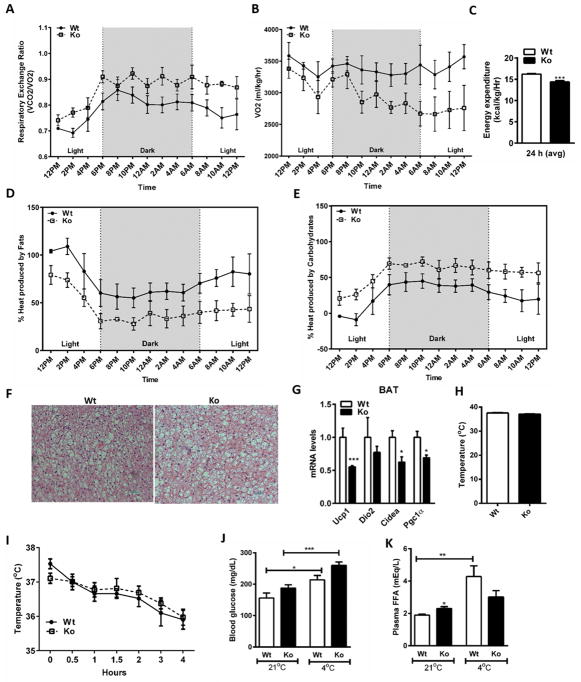
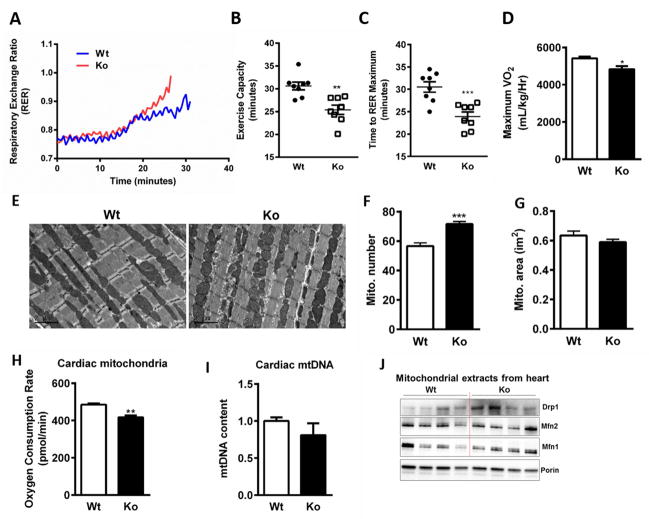
We recently identified human N-acetyltransferase 2 (NAT2) as an insulin resistance (IR) gene. Here, we examine the cellular mechanism linking NAT2 to IR and find that Nat1 (mouse ortholog of NAT2) is co-regulated with key mitochondrial genes. RNAi-mediated silencing of Nat1 led to mitochondrial dysfunction characterized by increased intracellular reactive oxygen species and mitochondrial fragmentation as well as decreased mitochondrial membrane potential, biogenesis, mass, cellular respiration, and ATP generation. These effects were consistent in 3T3-L1 adipocytes, C2C12 myoblasts, and in tissues from Nat1-deficient mice, including white adipose tissue, heart, and skeletal muscle. Nat1-deficient mice had changes in plasma metabolites and lipids consistent with a decreased ability to utilize fats for energy and a decrease in basal metabolic rate and exercise capacity without altered thermogenesis. Collectively, our results suggest that Nat1 deficiency results in mitochondrial dysfunction, which may constitute a mechanistic link between this gene and IR.

Keywords: NAT2; Nat1; adipose tissue; basal metabolic rate; fatty acids; insulin resistance; mitochondria; mitochondrial dysfunction; reactive oxygen species.


Conflict of interest statement

The authors declare no conflict of interest.

Figures

Figure 1
Figure 1
Metabolic characterization of Nat1 deficient mice (A) Body weight (B) Epididymal fat and (C) Liver weights of wild-type (Wt) and Nat1 deficient mice (Ko) at 16 weeks fed a chow diet (n=10–15 mice per group). Values are mean ± SEM. (D) Haematoxylin and eosin staining (H&E) of epididymal WAT of wild type and Nat1 deficient mice. Scale bar, 100×Pi (10X magnification). (E) Plasma adiponectin (F) Leptin (G) FFA concentrations were determined in mice fasted overnight (n=10–13 per genotype). Values represent means ± SEM. (***p ≤ 0.001, **p ≤ 0.01, *p < 0.05). Gene expression profiling in white adipose tissue in wild type and Nat1 Ko mice (n = 5–6 mice per group) using real-time quantitative PCR for expression of genes involved in lipid metabolism (H) and for inflammatory markers (I). The expression values were normalized to cyclophilin. Results represent mean ± SEM (**p ≤ 0.01, *p < 0.05).
Figure 2
Figure 2
Effect of Nat1 deficiency on fasting plasma metabolome and lipidome. (A) Hierarchical clustering of significantly different metabolites and lipids in fasting plasma from non-targeted metabolomics and lipidomics experiments (FDR < 0.1). Signal intensities were clustered in two dimensions (horizontal: metabolites and lipids; vertical: samples) on the basis of Euclidean distance. Colors indicate metabolite/lipid abundance as high (red), median (white), or low (blue). (B, C, D, E) Values are normalized to the median and expressed as box-and-whisker plots; n = 9–11; *p ≤ 0.05, **p ≤ 0.01, ***p ≤ 0.001. AC: acylcarnitine, DG: diacylglycerol, PC: phosphatidylcholine, PE: phosphatidylethanolamine, PI: phosphatidylinositol, SM: sphingomyelin, TG: triacylglycerol. The list of significantly changing metabolites and lipids are shown in Supplemental Table 1. Data obtained from non-fasting plasma samples are shown in Supplemental Figure 2.
Figure 3
Figure 3
Effect of Nat1 knockdown on mitochondrial functions. (A) Intracellular ROS measured using H2DCFDA in 3T3-L1 adipocytes transfected with scrambled siRNA (scr siRNA) or with siRNA against Nat1 (si Nat1). (B) Mitochondrial superoxides were measured by fluorescence microscopy in 3T3-L1 adipocytes transduced with lenti viral controls and sh Nat1 stained with MitoSOX Red (10 μM) (4X magnification). Mitochondrial membrane potential (ΔΨm) was monitored using TMRM staining (50 nM) in 3T3-L1 adipocytes. (C) Fluorescent microscopic analysis (20X magnification) and intensity of TMRM was quantified. (D) Membrane potential was further analyzed using fluorescent plate reader. Data are presented as mean ± SEM of 3 separate experiments, with 8 wells per condition. Mitochondrial mass was measured in 3T3-L1 adipocytes transduced with lenti virus controls and sh Nat1 using mitotracker deep red (100 nM). (E) Fluorescence was analyzed by flow cytometry. Values are mean ± SEM of triplicates of 3 different experiments (** p ≤ 0.01). (F) Confocal microscopy in 3T3-L1 adipocytes. (G) Quantitative PCR analysis of Pgc1a expression in 3T3-L1 adipocytes. Data represents mean ± SEM. (H) Western blot analysis of Pgc1a protein levels in differentiating mouse 3T3-L1 adipocytes. (I) Quantitative PCR analysis of mitochondrial genes in 3T3-L1 adipocytes normalized to cyclophilin. Representative results are shown of n = 3 experiments. Data are presented as mean ± SEM. *p < 0.05, **p ≤ 0.01, ***p < 0.001.
Figure 4
Figure 4
Effect of Nat1 on mitochondrial dynamics in 3T3-L1 adipocytes. Nat1 knockdown increased mitochondrial fission/fragmentation. (A) Confocal imaging of mitochondrial fragmentation in 3T3-L1 adipocytes transduced with lenti virus for controls and sh Nat1 stained with MitoTracker Red CMXRos (100 nM) and analyzed for mitochondrial area, perimeter, circularity and interconnectivity. Western blot analysis of mitochondrial proteins for (B) Mitochondrial fission quantified by imageJ, values are mean ± SEM of 2 different experiments (*p ≤ 0.05). (C) Fusion (D) Mitophagy in isolated mitochondrial and cytosolic fractions from 3T3-L1 adipocytes transduced with lenti virus for controls and sh Nat1. (E) Mitochondrial markers in isolated mitochondrial fractions from WAT of wild type and Nat1 deficient mice (n = 4).
Figure 5
Figure 5
Effect of Nat1 ablation on cellular respiration and ATP production in differentiated 3T3-L1 adipocytes. (A) Oxygen consumption rate (OCR) measured using the XF24 Extracellular Fluid Analyzer in 3T3-L1 adipocytes transduced with control pLV and sh Nat1. (B) Basal respiration and maximal respiration rates determined from A. (n = 9–10; ** p ≤ 0.01, ***p < 0.001). (C) Oxygen consumption rate (OCR) (D) Mitochondrial DNA content (mtDNA/nDNA) measured in WAT of wild type and Nat1 deficient mice (n=5) (* p ≤ 0.05). (E) Cellular ATP levels were measured in 3T3-L1 adipocytes. Data are presented as mean ± SEM of 3 separate experiments, with 5 wells per experiment. *p ≤ 0.05.
Figure 6
Figure 6
Decreased metabolic rate in Nat1 Ko mice. (A) RER (B) VO2 (C) Energy expenditure was measured in 4 month-old wild-type and Nat1 deficient mice given a normal chow diet for 24 h (n = 4 mice per group) (***p ≤ 0.001). (D and E) Heat production was measured for 24 hours in 4 month-old wild-type and Nat1 deficient mice given a normal diet for 24 h (n = 4). (F) H&E staining of brown adipose tissue of wild type and Nat1 deficient mice (n = 4). (G) Thermogenic gene expression in BAT of wild type and Nat1 deficient mice. (n = 3), normalized to cyclophilin. Results represent mean ± SEM. (H) Core body temperature was measured in 4 month-old wild-type and Nat1 deficient male mice fed a chow diet (n=5–8 mice). (I) Rectal temperature was measured every 30 min for 4 h after exposure to a 4°C environment (n=5–8 mice). (J) Blood glucose (K) Non-esterified fatty acids in plasma measured in wild-type and Nat1 deficient mice (*p ≤ 0.05, **p ≤ 0.01, ***p ≤ 0.001).
Figure 7
Figure 7
Nat1 deficiency on energy expenditure and cardiac phenotype in vivo. (A) Mean RER (B) Exercise capacity (C) Time to exhaust (D) Baseline and maximal VO2 were determined during exercise by treadmill protocol. Values are the means ± SEM of 8 mice per group (*p ≤ 0.05, **p ≤ 0.01, ***p ≤ 0.001). (E) Representative electron micrographs of the hearts of 4 month-old mice; scale bar, 2μm. (F and G) Mitochondrial number and area were quantified blindly from 8–10 images from different fields (n = 4) (***p ≤ 0.001). (H) Oxygen consumption rate of heart isolated mitochondria was assessed using an Oroboros Oxygraph-2k respirometer (n= 5–7 mice per group, **p ≤ 0.01). (I) Relative mitochondrial DNA (mtDNA) content measured in cardiac muscle of wild type and Nat1 deficient mice (n = 3). (J) Mitochondrial markers in isolated mitochondrial fractions from hearts of wild type and Nat1 deficient mice (n = 4).

References

    1. Bogacka I, Ukropcova B, McNeil M, Gimble JM, Smith SR. Structural and functional consequences of mitochondrial biogenesis in human adipocytes in vitro. J Clin Endocrinol Metab. 2005a;90:6650–6656. - PubMed
    1. Bogacka I, Xie H, Bray GA, Smith SR. Pioglitazone induces mitochondrial biogenesis in human subcutaneous adipose tissue in vivo. Diabetes. 2005b;54:1392–1399. - PubMed
    1. Cannon B, Nedergaard J. Nonshivering thermogenesis and its adequate measurement in metabolic studies. Journal of Experimental Biology. 2011;214:242–253. - PubMed
    1. Chennamsetty I, Claudel T, Kostner KM, Baghdasaryan A, Kratky D, Levak-Frank S, Frank S, Gonzalez FJ, Trauner M, Kostner GM. Farnesoid X receptor represses hepatic human APOA gene expression. J Clin Invest. 2011;121:3724–3734. - PMC - PubMed
    1. Choo HJ, Kim JH, Kwon OB, Lee CS, Mun JY, Han SS, Yoon YS, Yoon G, Choi KM, Ko YG. Mitochondria are impaired in the adipocytes of type 2 diabetic mice. Diabetologia. 2006;49:784–791. - PubMed

MeSH terms

Supplementary concepts

LinkOut - more resources