. 2016 Nov 15;7(46):75441-75456.
doi: 10.18632/oncotarget.12254.

TACC3 overexpression in cholangiocarcinoma correlates with poor prognosis and is a potential anti-cancer molecular drug target for HDAC inhibitors

Affiliations

TACC3 overexpression in cholangiocarcinoma correlates with poor prognosis and is a potential anti-cancer molecular drug target for HDAC inhibitors

Jun-Chuang He et al. Oncotarget. .

Abstract

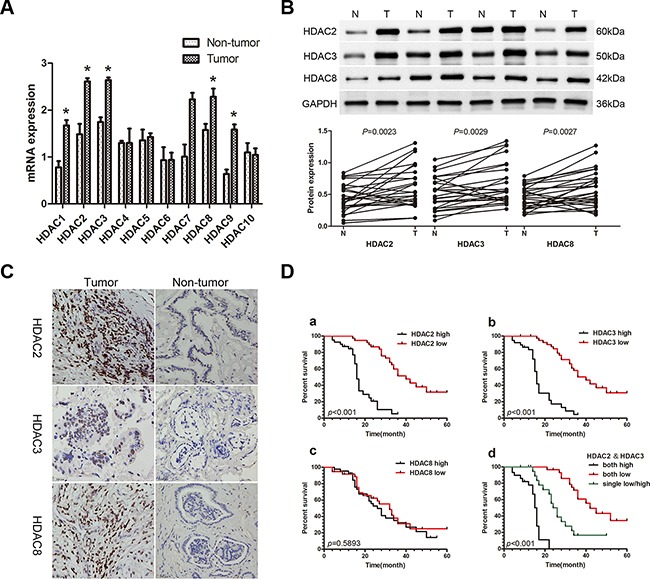
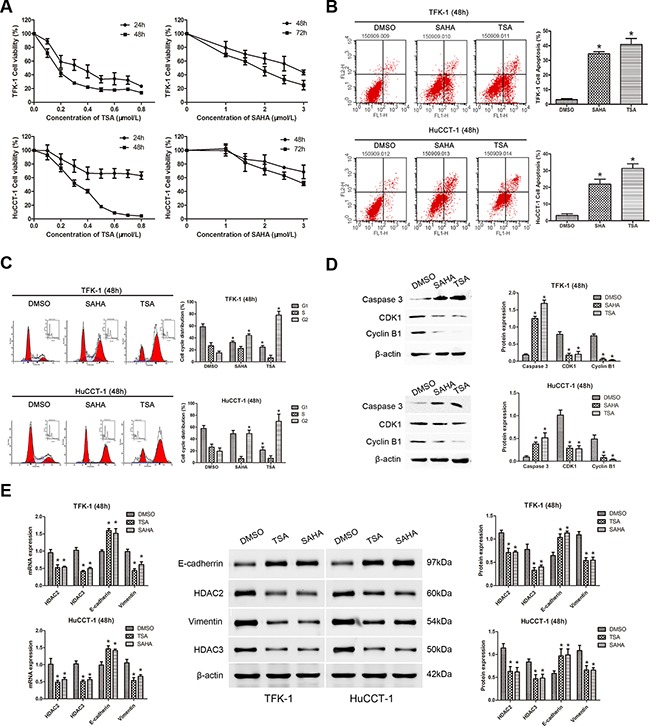
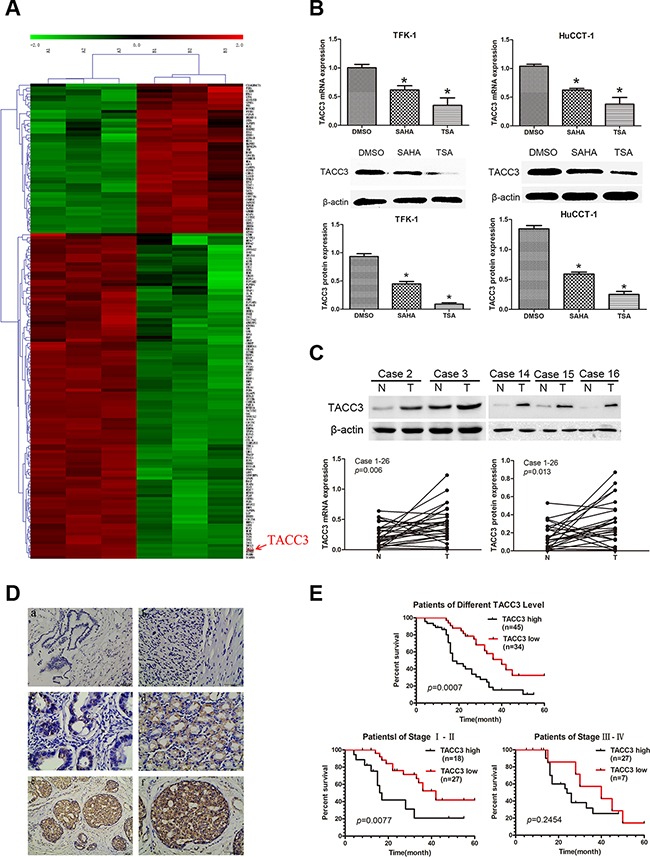
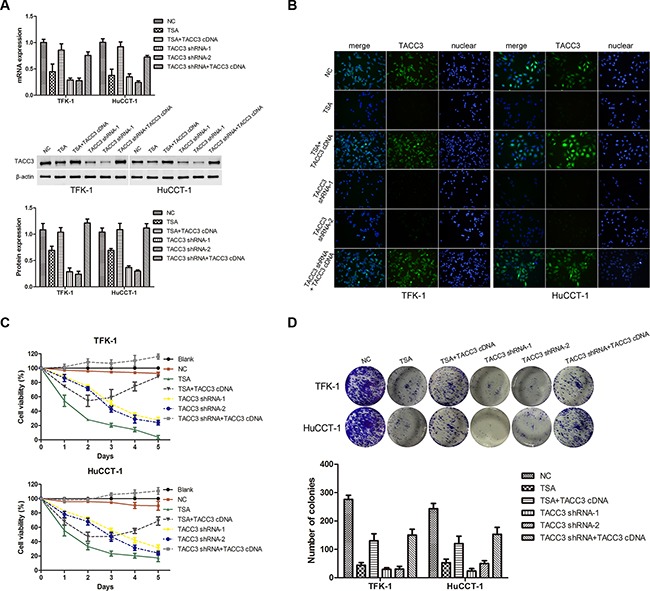
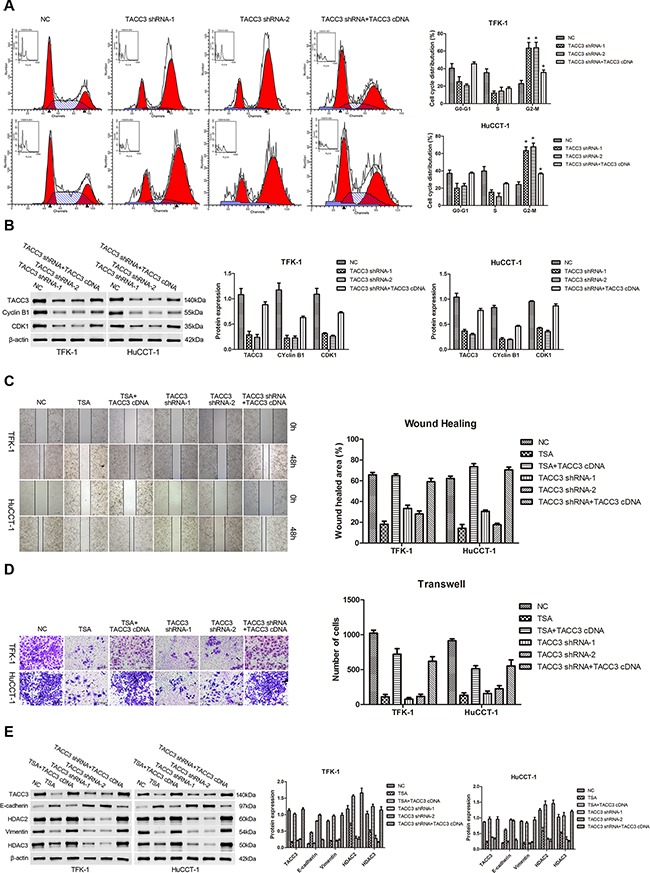
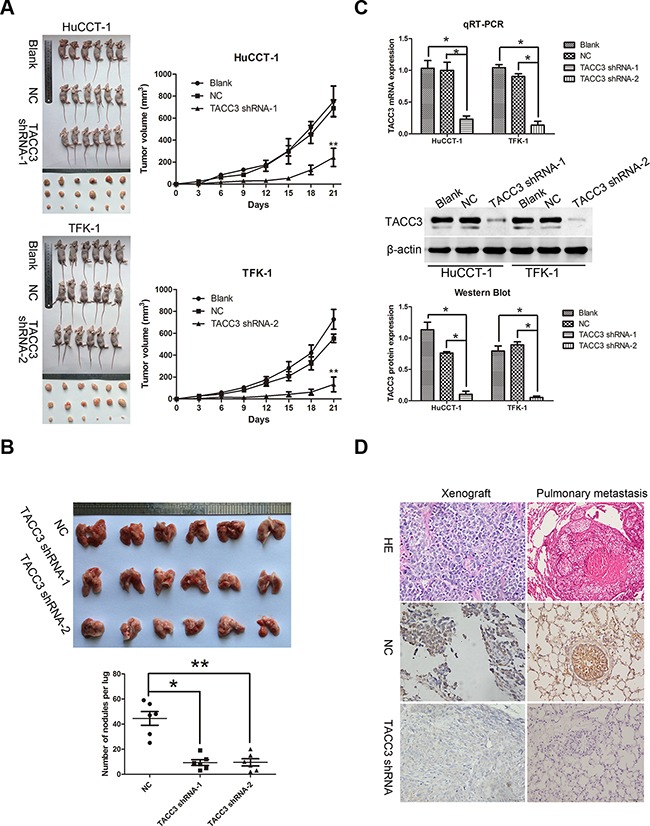
Histone deacetylases (HDACs) have been implicated in multiple malignant tumors, and HDAC inhibitors (HDACIs) exert anti-cancer effects. However, the expression of HDACs and the anti-tumor mechanism of HDACIs in cholangiocarcinoma (CCA) have not yet been elucidated. In this study, we found that expression of HDACs 2, 3, and 8 were up-regulated in CCA tissues and those patients with high expression of HDAC2 and/or HDAC3 had a worse prognosis. In CCA cells, two HDACIs, trichostatin (TSA) and vorinostat (SAHA), suppressed proliferation and induced apoptosis and G2/M cycle arrest. Microarray analysis revealed that TACC3 mRNA was down-regulated in CCA cells treated with TSA. TACC3 was highly expressed in CCA tissues and predicted a poor prognosis in CCA patients. TACC3 knockdown induced G2/M cycle arrest and suppressed the invasion, metastasis, and proliferation of CCA cells, both in vitro and in vivo. TACC3 overexpression reversed the effects of its knockdown. These findings suggest TACC3 may be a useful prognostic biomarker for CCA and is a potential therapeutic target for HDACIs.

Keywords: HDAC inhibitors (HDACIs); cholangiocarcinoma (CCA); histone deacetylase (HDAC); microarray; transforming acidic coiled-coil-containing protein 3 (TACC3).


Conflict of interest statement

CONFLICTS OF INTEREST

No potential conflicts of interest were declared.

Figures

Figure 1
Figure 1. Expression of HDACs in patients with CCA and the correlation of the HDAC2/3 expression with poor prognosis
A. qRT-PCR was used to measure the expression of class I and class II HDACs in 26 paired CCA and non-tumor tissue samples. Total RNA was isolated from at least three samples of each tissue and ACTB was used as the internal control. Fold changes were calculated through relative quantification (2−ΔΔCt). Data are shown as mean ± SD, *P<0.05. B. Western blot was used to detect protein expression of HDACs 2, 3, and 8. GAPDH was used as the internal control and all experiments were repeated three times. A representative image is shown (upper panel), and the statistical analysis of the relative optical density of each band is shown (lower panel). *P<0.05. C. Representative IHC staining of HDACs 2, 3 and 8 in CCA tissues and paired adjacent non-tumor tissue (400X). Scale bar, 100μm. D. Kaplan-Meier analysis. a. Patients with low HDAC2 expression (n=37) had longer overall survival (OS) than patients with high HDAC2 expression (n=42; median OS: 40 months vs 16 months, P<0.001, log-rank test). b. Patients with low HDAC3 expression (n=35) had longer OS than patients with high HDAC3 expression (n=44; median OS: 43 months vs 17 months, P<0.001, log-rank test). c. There were no differences in OS between the low HDAC8 expression group (n=37) and the high HDAC8 expression group (n=42; median OS: 32 months vs 26 months, P=0.5893, log-rank test). d. Patients with lower expression of both HDAC2 and HDAC3 (n=21) had a longer OS than patients with higher expression of both HDAC2 and HDAC3 (n=22), or low expression of either HDAC2 or HDAC3 (n=36; median OS: 42 months vs 16 months vs 25 months, P<0.001, log-rank test).
Figure 2
Figure 2. TSA and SAHA suppress cell proliferation, promote cell apoptosis, induce cell cycle arrest, and restrain EMT in CCA cell lines
For all experiments, TFK-1 and HuCCT-1 cells were incubated with the indicated concentrations (IC50 values at 48 hours) of TSA (left panels) or SAHA (right panels). 1% DMSO treatment was used as a negative control and each experiment was repeated three times. Data are presented as means ± SD. A. The survival rates of TFK-1 (upper panel) and HuCCT-1 (lower panel) cells were detected by CCK-8 assay. Survival Rate % = (ODtreated − ODblank)/(ODcontrol − ODblank) × 100%. B. Apoptotic cells were analyzed by FACS via staining of annexin V. The percentage of apoptotic cells is shown (TFK-1, upper panels; HuCCT-1, lower panels; * P<0.05). C. An increased number of cells in G2/M phase was found by FACS analysis after treatment with TSA or SAHA. The percentage of TFK-1 cells in G1 phase was also markedly decreased. A decrease in the percentage of HuCCT-1 cells in G1 phase only observed after treatment with TSA (TFK-1, upper panels; HuCCT-1, lower panels; *P<0.05). D. Western blot demonstrated that the expression of the caspase 3 was increased, while the expression of the G2/M phase checkpoint proteins, CDK1 and cyclin B1, was down-regulated in TFK-1 (upper panels) and HuCCT-1 (lower panels) cells after treatment with TSA or SAHA. β-actin was used as the internal control. *P<0.05. E. qRT-PCR was used to analyze the mRNA expression of HDAC2, HDAC3, CDH1, and VIM in TFK-1 and HuCCT-1 cell lines after treatment with TSA or SAHA, ACTB was used as the internal control (Left panels, *P<0.05). Western blot was used to explore protein expression of HDAC2, HDAC3, E-cadherin, and vimentin in TFK-1 and HuCCT-1 cell lines after treatment with TSA or SAHA. β-actin was used as the internal control (Left panels, *P<0.05). Representative images are shown (middle panels). Statistical analysis of the relative optical density of each band is shown (right panels, *P<0.05).
Figure 3
Figure 3. Microarray analysis indicates TACC3 as a molecular drug target of HDAC inhibitors, and the expression of TACC3 correlates with the prognosis of CCA patients
A. Hierarchical clustering analysis of 163 mRNAs involved in cell proliferation and migration that were differentially expressed (Fold Change ≥ 2.0 and P-value ≤ 0.05) after treatment with TSA (right) compared with 1% DMSO (left), which was used as negative control. Red coloring indicates up-regulated and green indicates means down-regulated expression. B. Expression of TACC3 mRNA (upper panels) and protein (lower panels) in TFK-1 and HuCTT-1 cells was validated by qRT-PCR and WB. Cells were treated with the indicated concentrations of TSA and SAHA (respective IC50 values at 48 hours). 1% DMSO treatment was used as negative control and β-actin was used as the internal control. These experiments were repeated three times, and data are shown as mean ± SD, *P<0.05. C. Expression of TACC3 mRNA and protein in CCA samples and adjacent non-tumor bile duct tissues (n=26) was analyzed by qRT-PCR (P=0.006) and WB (P=0.013). Representative images are shown in the upper panel. β-actin (or ACTB) was used as the internal control, experiments were repeated three times, and data are shown as mean ± SD, *P<0.05. D. The expression of TACC3 in CCA tissues and adjacent non-tumor tissues (n=79) analyzed by IHC. (a) negative TACC3 staining in adjacent non-tumor bile duct tissues (200X); (b) negative TACC3 staining in CCA tissues (400X); (c) weak TACC3 staining in the cytoplasm (400X); (d) moderate TACC3 staining in the cytoplasm (400X); (e, f) strong TACC3 staining in the cytoplasm (200X,400X). Scale bar, 100 μm. E. Kaplan-Meier analysis showing that patients with low TACC3 expression (n=34) had longer OS than patients with high TACC3 expression (n=45; median OS: 40 months vs 17 months, P<0.001). Patients in stage I-II with low TACC3 expression (n=27) had longer OS than patients with high TACC3 expression (n=18; median OS: 42 months vs 17 months, P=0.0077). However, there was no correlation observed in patients with stage III-IV CCA (median OS: 40 months vs 25 months, P=0.2454, log-rank test).
Figure 4
Figure 4. Knockdown of TACC3 suppresses proliferation and colony formation of CCA cells
TFK-1 and HuCCT-1 cells were treated with TSA or small interfering RNAs as indicated, and empty vector was used as the negative control (NC). A. qRT-PCR and western blot assays were used to detect the expression of TACC3. For WB analysis, representative imagines are shown (middle panels). Statistical analysis of the relative optical density of each band is shown (lower panels). β-actin was used as an internal control, experiments were repeated three times, and data are shown as mean ± SD, *P<0.05. B. Immunofluorescence was used to detect the expression of TACC3 (green). DAPI (blue) was used to stain the nuclei. The fluorescence intensity of TACC3 was stronger in NC groups, and was weaker in cells treated with TSA or transfected with shRNA. In the TACC3 shRNA rescue experiment, fluorescence intensity was recovered. One representative experiment out of the three performed is shown (400X). C. Survival rate of TFK-1 and HuCCT-1 cells was detected by CCK-8 assay. Experiments were repeated three times and data are shown as mean ± SD. D. Colony formation assays were performed to evaluate the proliferative capability of TFK-1 (upper panel) and HuCCT-1(lower panel) cells. A representative image is shown, and a statistical comparison of the indicated groups was performed across three independent experiments, *P<0.05 and **P<0.001.
Figure 5
Figure 5. Knockdown of TACC3 induces G2/M cell cycle arrest and suppresses the migration and invasion of CCA cells
For all experiments, cells transfected with empty vector were used as negative control (NC), and experiments were repeated three times. Data are shown as mean ± SD. A. FACS analysis was used to investigate differences in cell cycle distribution following TACC3 silencing or overexpression. TACC3 silencing drove G2/M arrest in TFK-1 (upper panels) and HuCCT-1 (lower panels) cells. In addition, when TACC3 knockdown cells were given TACC3 cDNA, the G2/M phase distribution was decreased. *P<0.05. B. WB results indicated that the expression of CDK1 and cyclin B1 were down-regulated with TACC3 knockdown, and were up-regulated when cells were given TACC3 cDNA. Representative imagines are shown (left panels). Statistical analysis of the relative optical density of each band is shown (right panels). β-actin was used as an internal control, *P<0.05. C. Wound healing assays was performed to explore the migration capability, and solid lines represent the wound edges. Images were captured using light microscopy (4X). The migration index was calculated as described in the Materials and Methods (TFK-1, upper panels; HuCCT-1, lower panels). Representative images are shown (left panel). Statistical analysis is shown (right panel), *P<0.05 and **P<0.001. D. Transwell assay was used to investigate the invasiveness of cells. The number of cells that invaded through the membrane was determined under a light microscope (200X). Representative images are shown (left panel). Statistical analysis is shown (right panel), *P<0.05 and **P<0.001. E. Western blot assay was employed to investigate the expression of E-cadherin, vimentin, HDAC2, and HDAC3. Representative images are shown (left panels). Statistical analysis of the relative optical density of each band is shown (right panels). β-actin was used as an internal control, *P<0.05.
Figure 6
Figure 6. Targeted silencing of TACC3 suppresses CCA tumorigenicity and metastasis, in vivo.
A. The effects of TACC3 silencing on tumor suppression in vivo. Images of tumors formed in nude mice injected subcutaneously with HuCCT-1 cells transfected with the blank, negative vector, and TACC3 shRNA-1 (upper). Images of tumors formed in nude mice injected subcutaneously with TFK-1 cells transfected with the blank, negative vector and TACC3 shRNA-2 (lower). Tumor growth curves are plotted (right). **P<0.001. B. A pulmonary metastasis model was established after 6 weeks of the indicated treatment. Images from the pulmonary metastasis model (upper panel) and the corresponding statistical analysis (lower panel) are shown. *P<0.05 and **P<0.001. C. qRT-PCR (upper panel) and WB (middle and lower panel) were used to assess TACC3 mRNA and protein expression in tumor xenografts. *P<0.05. D. IHC was used to detect the expression of TACC3 in tumor xenografts and pulmonary metastasis tumor tissues (400X). Scale bar, 100 μm.

Similar articles

Cited by

References

    1. Rizvi S, Gores GJ. Pathogenesis, diagnosis, and management of cholangiocarcinoma. Gastroenterology. 2013;145:1215–1229. - PMC - PubMed
    1. Patel T. Worldwide trends in mortality from biliary tract malignancies. BMC Cancer. 2002;2:10. - PMC - PubMed
    1. Patt YZ, Hassan MM, Lozano RD, Waugh KA, Hoque AM, Frome AI, Lahoti S, Ellis L, Vauthey JN, Curley SA, Schnirer, Raijman I. Phase II trial of cisplatin, interferon alpha-2b, doxorubicin, and 5-fluorouracil for biliary tract cancer. Clinical cancer research. 2001;7:3375–3380. - PubMed
    1. Martin R, Jarnagin W. Intrahepatic cholangiocarcinoma. Current management. Minerva Chir. 2003;58:469–478. - PubMed
    1. Lee MA, Woo IS, Kang JH, Hong YS, Lee KS. Epirubicin, cisplatin, and protracted infusion of 5-FU (ECF) in advanced intrahepatic cholangiocarcinoma. J Cancer Res Clin Oncol. 2004;130:346–350. - PMC - PubMed

MeSH terms