

Local Geographic Variation of Public Services Inequality: Does the Neighborhood Scale Matter?
- PMID: 27706072
- PMCID: PMC5086720
- DOI: 10.3390/ijerph13100981
Local Geographic Variation of Public Services Inequality: Does the Neighborhood Scale Matter?
Abstract
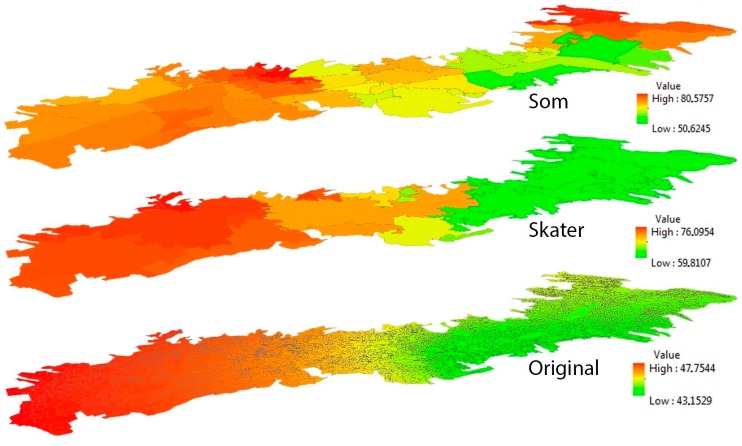
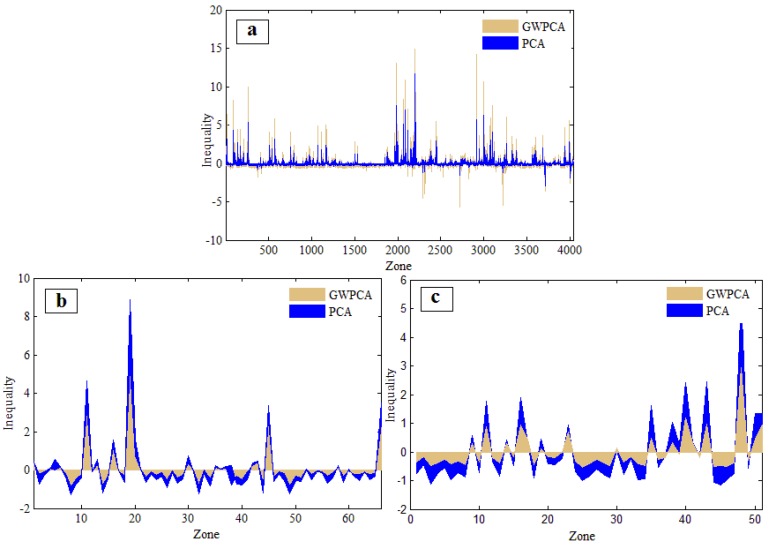
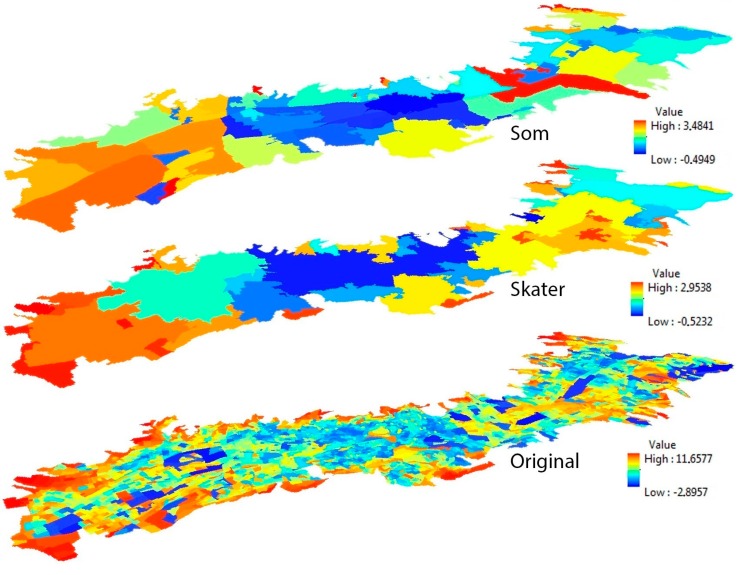
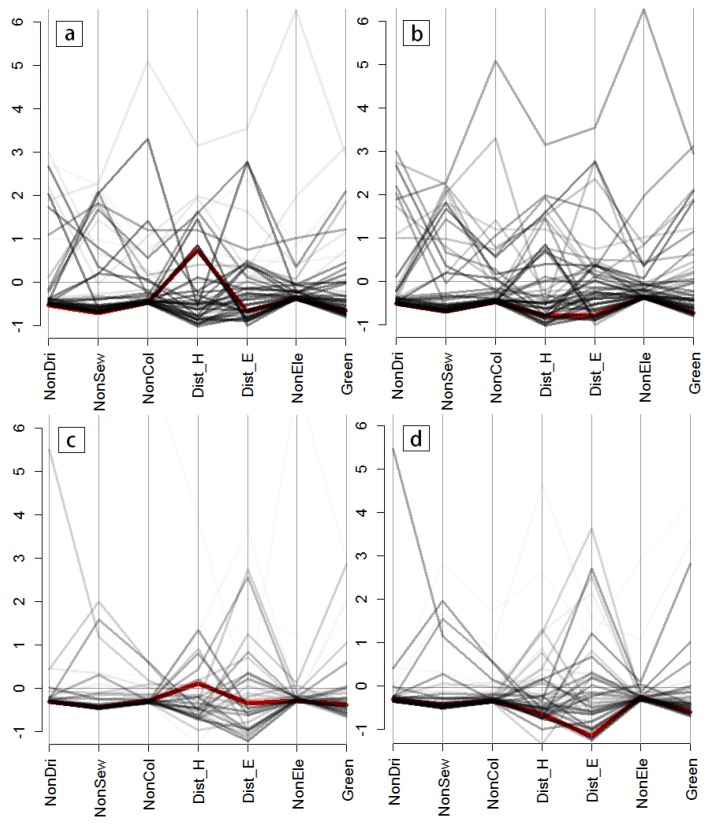
This study aims to explore the effect of the neighborhood scale when estimating public services inequality based on the aggregation of social, environmental, and health-related indicators. Inequality analyses were carried out at three neighborhood scales: the original census blocks and two aggregated neighborhood units generated by the spatial "k"luster analysis by the tree edge removal (SKATER) algorithm and the self-organizing map (SOM) algorithm. Then, we combined a set of health-related public services indicators with the geographically weighted principal components analyses (GWPCA) and the principal components analyses (PCA) to measure the public services inequality across all multi-scale neighborhood units. Finally, a statistical test was applied to evaluate the scale effects in inequality measurements by combining all available field survey data. We chose Quito as the case study area. All of the aggregated neighborhood units performed better than the original census blocks in terms of the social indicators extracted from a field survey. The SKATER and SOM algorithms can help to define the neighborhoods in inequality analyses. Moreover, GWPCA performs better than PCA in multivariate spatial inequality estimation. Understanding the scale effects is essential to sustain a social neighborhood organization, which, in turn, positively affects social determinants of public health and public quality of life.
Keywords: GWPCA; PCA; health; inequality; neighborhood; public services; scale.
Conflict of interest statement
The authors declare that they have no competing interests.
Figures


Similar articles
-
Modeling Pediatric Body Mass Index and Neighborhood Environment at Different Spatial Scales.Int J Environ Res Public Health. 2018 Mar 8;15(3):473. doi: 10.3390/ijerph15030473. Int J Environ Res Public Health. 2018. PMID: 29518029 Free PMC article.
-
Comparing Global and Spatial Composite Measures of Neighborhood Socioeconomic Status Across US Counties.J Urban Health. 2022 Jun;99(3):457-468. doi: 10.1007/s11524-022-00632-8. Epub 2022 Apr 28. J Urban Health. 2022. PMID: 35484371 Free PMC article.
-
Demarcation of local neighborhoods to study relations between contextual factors and health.Int J Health Geogr. 2010 Jun 29;9:34. doi: 10.1186/1476-072X-9-34. Int J Health Geogr. 2010. PMID: 20587046 Free PMC article.
-
Evaluating and Modeling Neighborhood Diversity and Health Using Electronic Health Records.Med Decis Making. 2022 Nov;42(8):1027-1040. doi: 10.1177/0272989X221123569. Med Decis Making. 2022. PMID: 36255188 Free PMC article. Review.
-
Neighborhoods And Health: Interventions At The Neighborhood Level Could Help Advance Health Equity.Health Aff (Millwood). 2024 Feb;43(2):156-163. doi: 10.1377/hlthaff.2023.01037. Health Aff (Millwood). 2024. PMID: 38315920 Review.
Cited by
-
Spatial patterns in sociodemographic factors explain to a large extent the prevalence of hypertension and diabetes in Aragon (Spain).Front Med (Lausanne). 2023 Jan 25;10:1016157. doi: 10.3389/fmed.2023.1016157. eCollection 2023. Front Med (Lausanne). 2023. PMID: 36760398 Free PMC article.
-
A spatial clustering-based approach to design monitoring networks of infectious diseases: a case study of hand, foot, and mouth disease.Infect Dis Poverty. 2025 Jul 28;14(1):76. doi: 10.1186/s40249-025-01331-7. Infect Dis Poverty. 2025. PMID: 40722199 Free PMC article.
-
Association between snack intake behaviors of children and neighboring women: A population-based cross-sectional analysis with spatial regionalization.SSM Popul Health. 2024 Oct 13;28:101720. doi: 10.1016/j.ssmph.2024.101720. eCollection 2024 Dec. SSM Popul Health. 2024. PMID: 39506981 Free PMC article.
-
Applying the Spatial Transmission Network to the Forecast of Infectious Diseases Across Multiple Regions.Front Public Health. 2022 Mar 11;10:774984. doi: 10.3389/fpubh.2022.774984. eCollection 2022. Front Public Health. 2022. PMID: 35359784 Free PMC article.
References
-
- Baum F. The New Public Health. 2nd ed. Oxford University Press; Oxford, UK: 2016. pp. 607–608.
-
- Gostin L.O., Gostin L.O. Public Health Law: Power, Duty, Restraint. Volume 3. University of California Press; Berkeley, CA, USA: 2000. pp. 524–525.
-
- Llewelyn-Davies (Firm) Holden McAllister Partnership . Safer Places: The Planning System and Crime Prevention. Thomas Telford; London, UK: 2004. pp. 48–50.
-
- Newman J.E., Clarke J.H. Publics, Politics and Power: Remaking the Public in Public Services. SAGE Publications Ltd.; Thousand Oaks, CA, USA: 2009. pp. 234–236.
-
- Harvey B., Schaefer A. Managing relationships with environmental stakeholders: A study of UK water and electricity utilities. J. Bus. Ethics. 2001;30:243–260. doi: 10.1023/A:1006356928957. - DOI
MeSH terms
LinkOut - more resources
Full Text Sources
Other Literature Sources
