Susceptibility to Heat-Related Fluid and Electrolyte Imbalance Emergency Department Visits in Atlanta, Georgia, USA
- PMID: 27706089
- PMCID: PMC5086721
- DOI: 10.3390/ijerph13100982
Susceptibility to Heat-Related Fluid and Electrolyte Imbalance Emergency Department Visits in Atlanta, Georgia, USA
Abstract
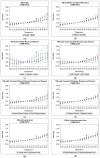
Identification of populations susceptible to heat effects is critical for targeted prevention and more accurate risk assessment. Fluid and electrolyte imbalance (FEI) may provide an objective indicator of heat morbidity. Data on daily ambient temperature and FEI emergency department (ED) visits were collected in Atlanta, Georgia, USA during 1993-2012. Associations of warm-season same-day temperatures and FEI ED visits were estimated using Poisson generalized linear models. Analyses explored associations between FEI ED visits and various temperature metrics (maximum, minimum, average, and diurnal change in ambient temperature, apparent temperature, and heat index) modeled using linear, quadratic, and cubic terms to allow for non-linear associations. Effect modification by potential determinants of heat susceptibility (sex; race; comorbid congestive heart failure, kidney disease, and diabetes; and neighborhood poverty and education levels) was assessed via stratification. Higher warm-season ambient temperature was significantly associated with FEI ED visits, regardless of temperature metric used. Stratified analyses suggested heat-related risks for all populations, but particularly for males. This work highlights the utility of FEI as an indicator of heat morbidity, the health threat posed by warm-season temperatures, and the importance of considering susceptible populations in heat-health research.
Keywords: climate change; emergency department visits; fluid and electrolyte imbalance; heat morbidity; temperature.
Conflict of interest statement
The authors declare no conflict of interest. The founding sponsors had no role in the design of the study; in the collection, analyses, or interpretation of data; in the writing of the manuscript, and in the decision to publish the results.
Figures


References
-
- World Health Organization . Quantitative Risk Assessment of the Effects of Climate Change on Selected Causes of Death, 2030s and 2050s. World Health Organization; Geneva, Switzerland: 2014.
-
- Confalonieri U., Menne B., Akhtar R., Ebi K.L., Hauengue M., Kovats R.S., Revich B., Woodward A. Human health. In: Parry M.L., Canziani O.F., Palutikof J.P., van der Linden P.J., Hanson C.E., editors. Climate Change 2007: Impacts, Adaptation and Vulnerability. Contribution of Working Group II to the Fourth Assessment Report of the Intergovernmental Panel on Climate Change. Cambridge University Press; Cambridge, UK: 2007. pp. 391–431.
-
- U.S. Global Change Research Program . In: Climate Change Impacts in the United States: The Third National Climate Assessment. Melillo J.M., Richmond T.C., Yohe G.W., editors. U.S. Global Change Research Program; Washington, DC, USA: 2014. p. 841.
MeSH terms
Substances
Grants and funding
LinkOut - more resources
Full Text Sources
Other Literature Sources
Medical

